Visualizations#
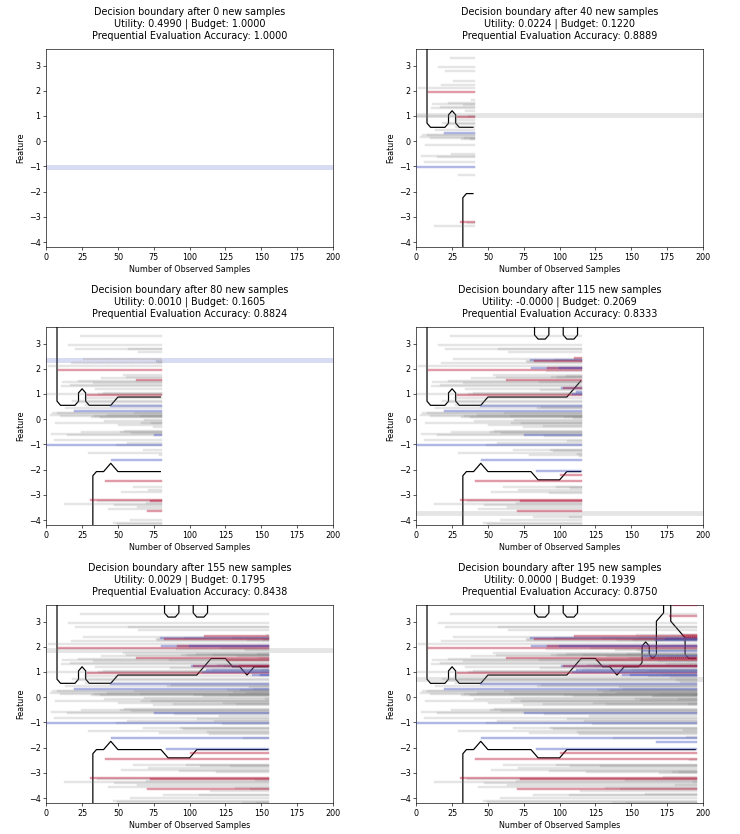
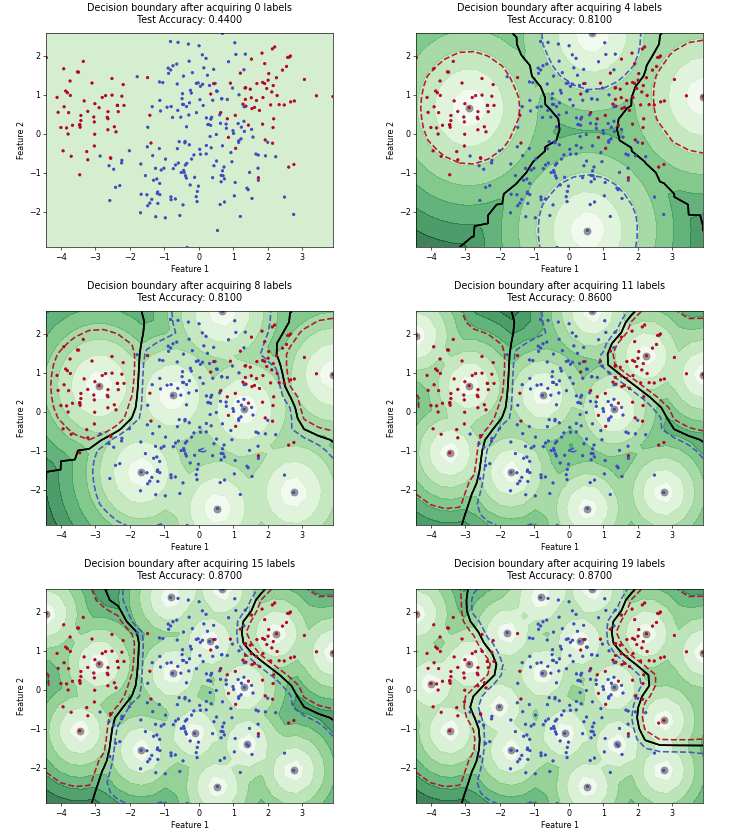
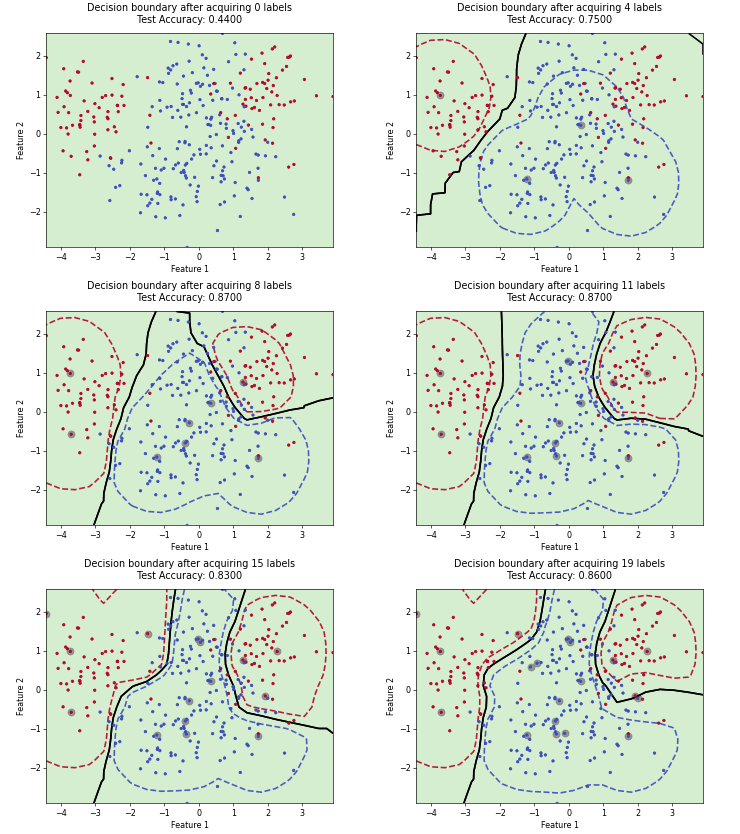
On this page, we illustrate how different query strategies behave across various active learning scenarios. To this end, we generate synthetic, low-dimensional toy datasets that allow us to visualize the distribution of samples selected for labeling in feature space. Each example consists of an animation and accompanying code that plot the results across individual active learning cycles.
🏊 Pool-based Active Learning: Classification#

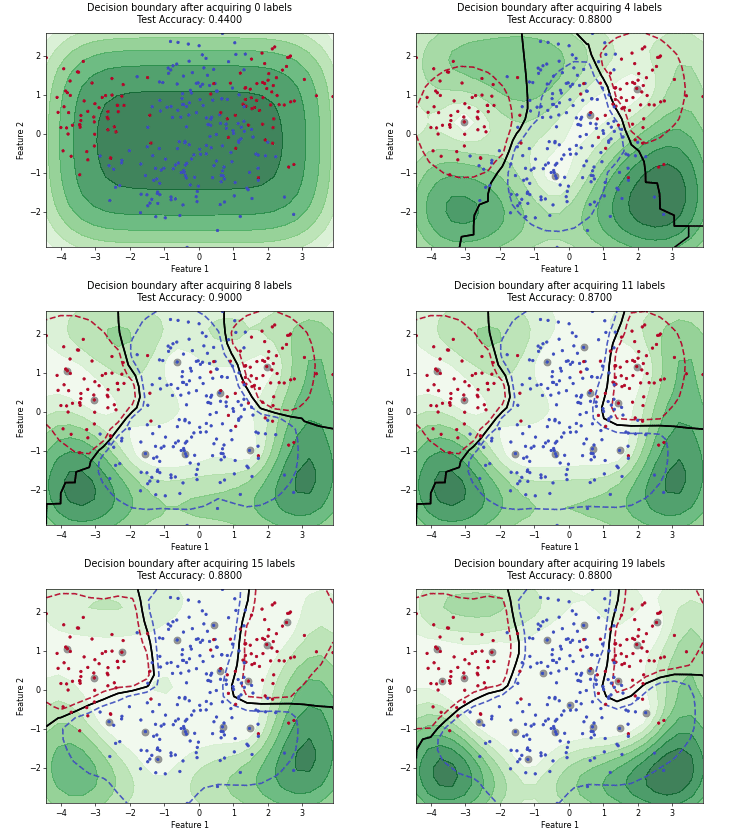
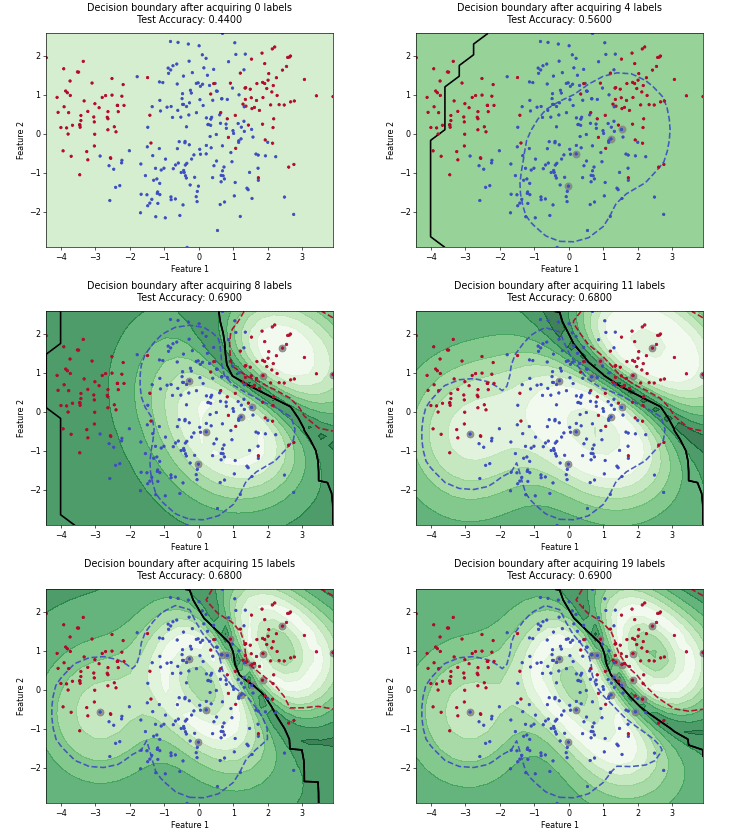
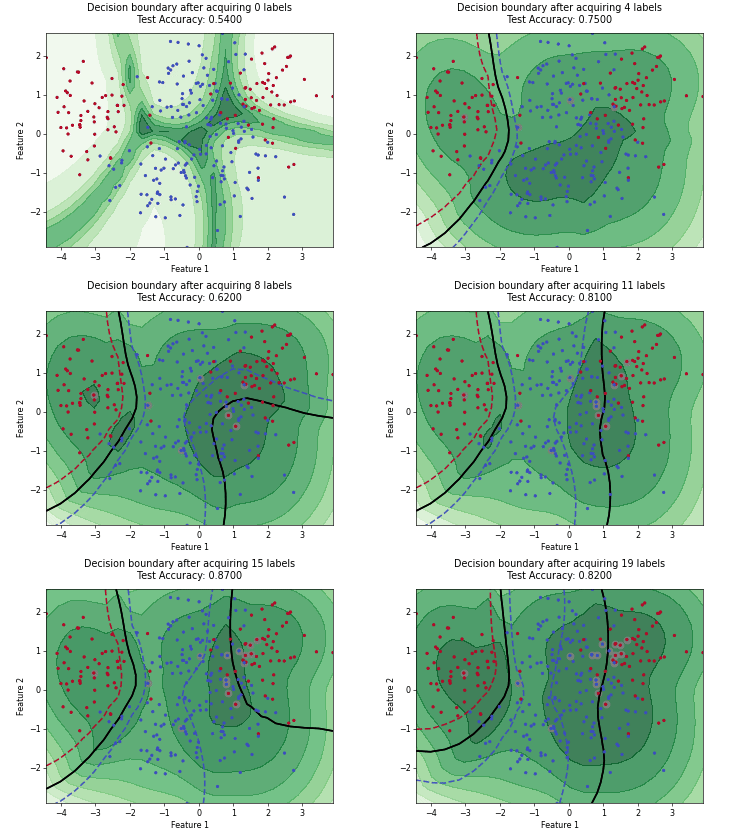
Density-Diversity-Distribution-Distance Sampling (4DS)
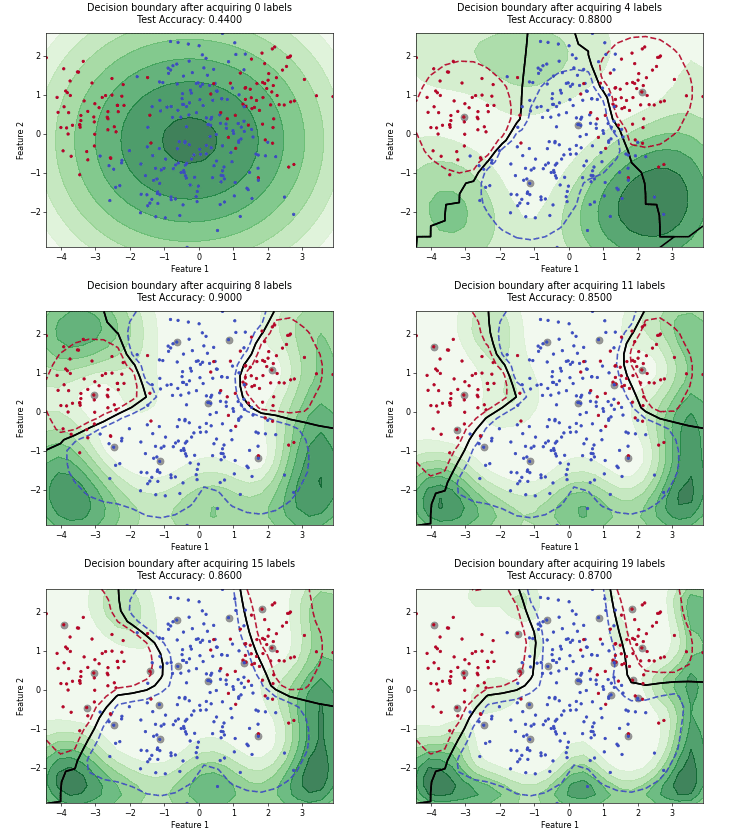
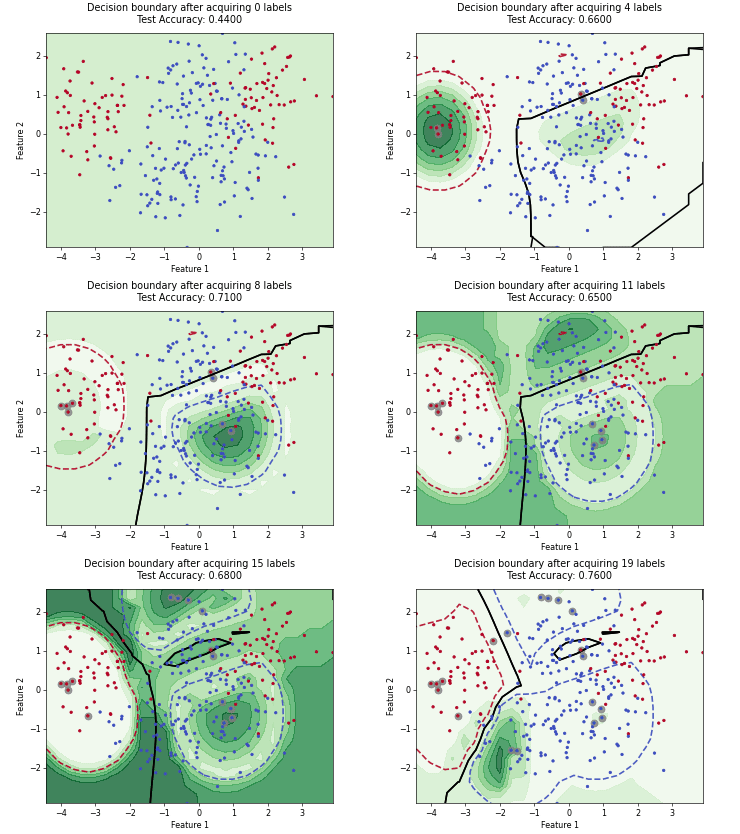
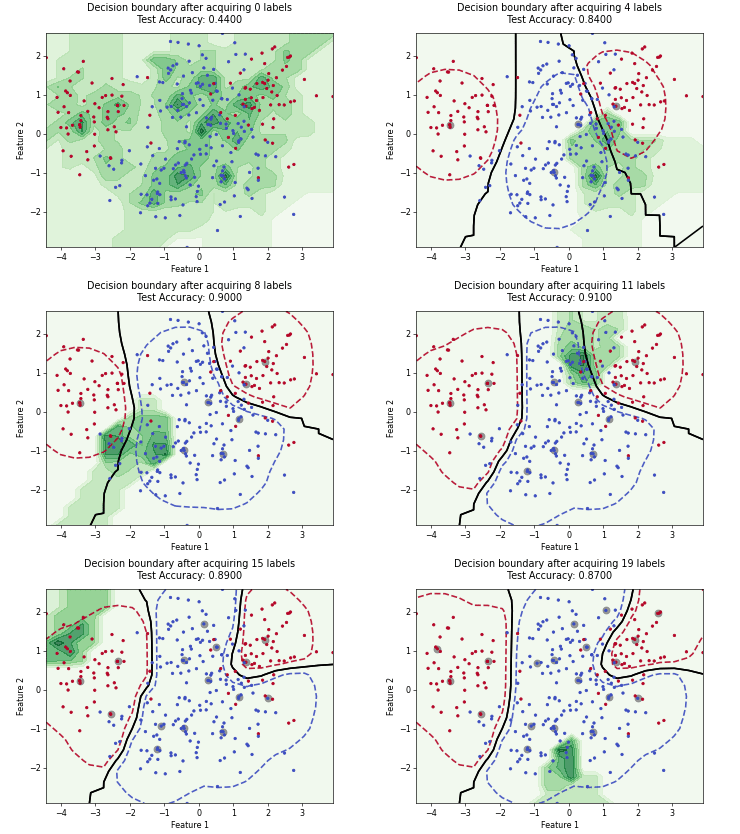
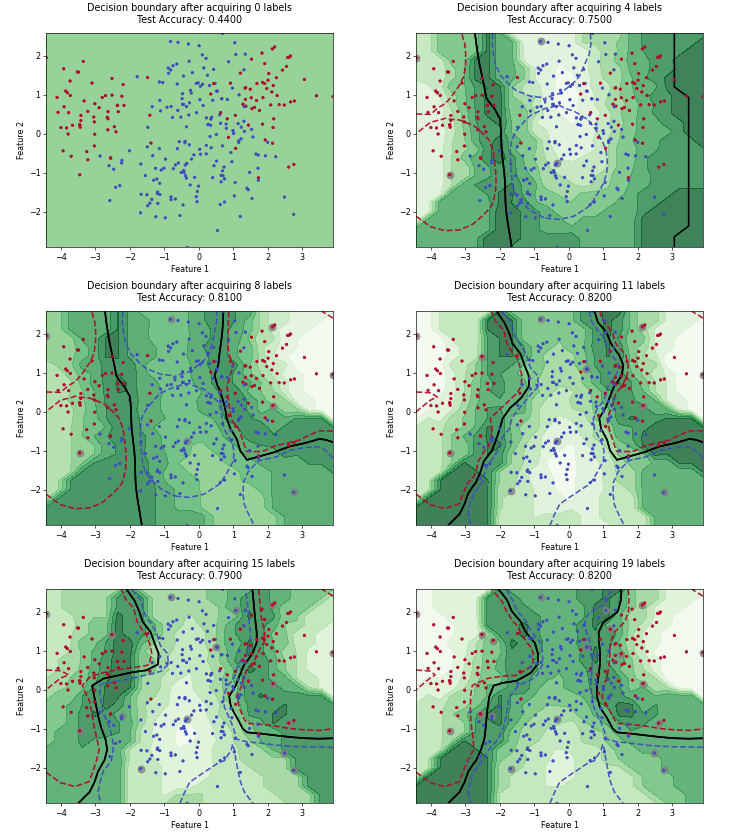
Querying Informative and Representative Examples (QUIRE)
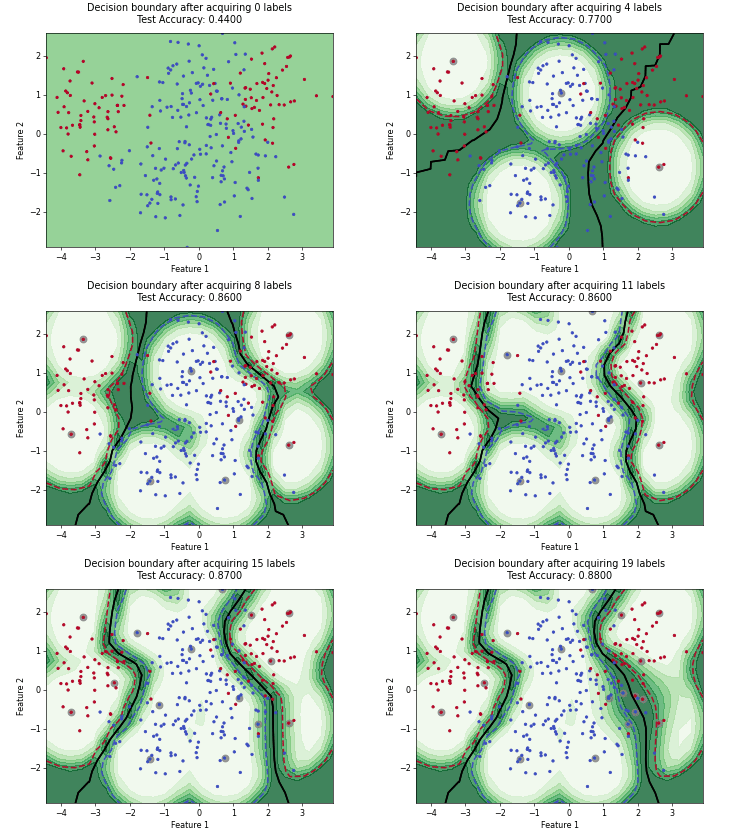
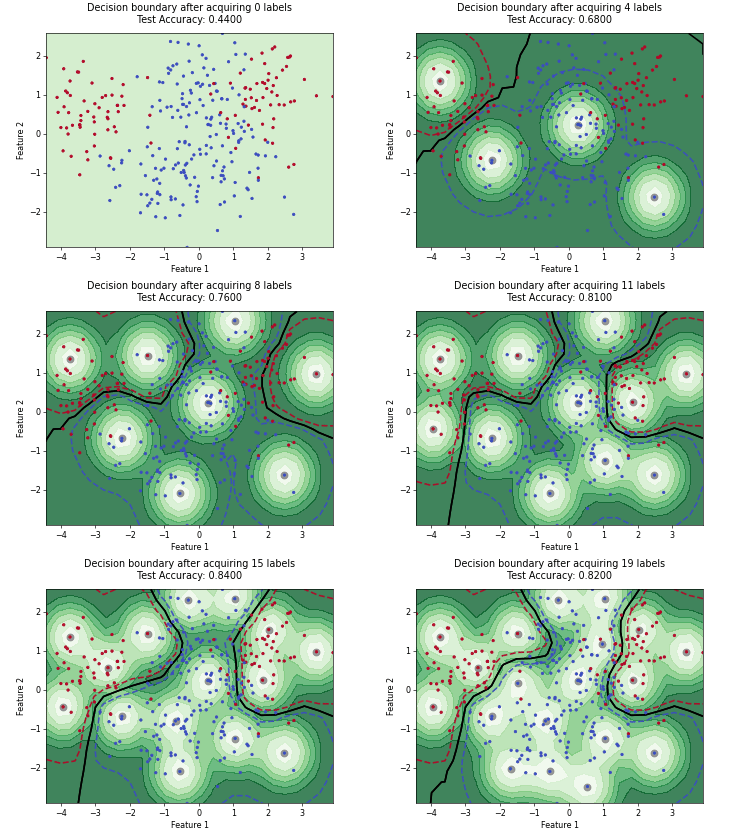
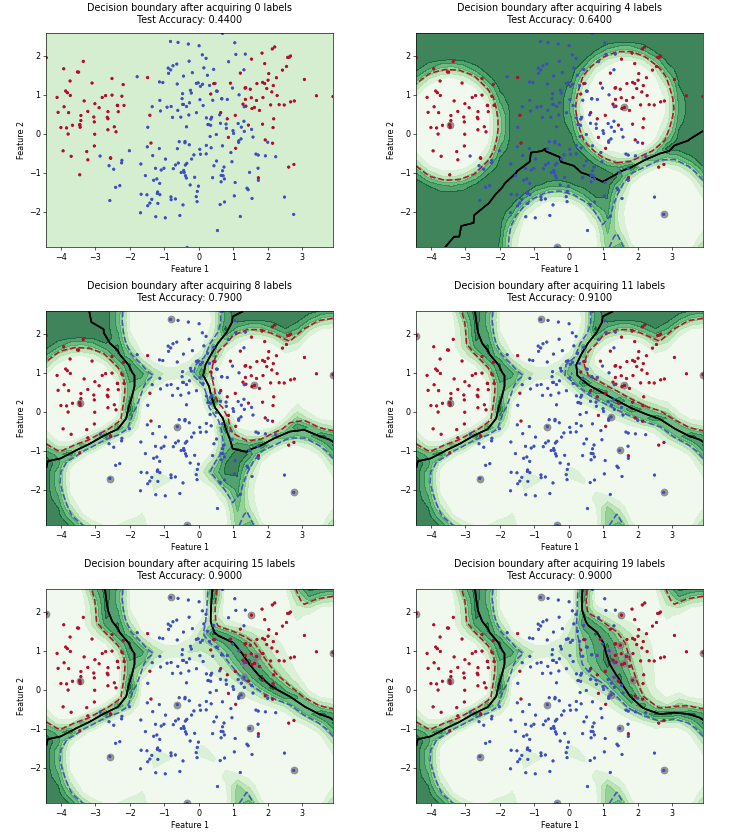
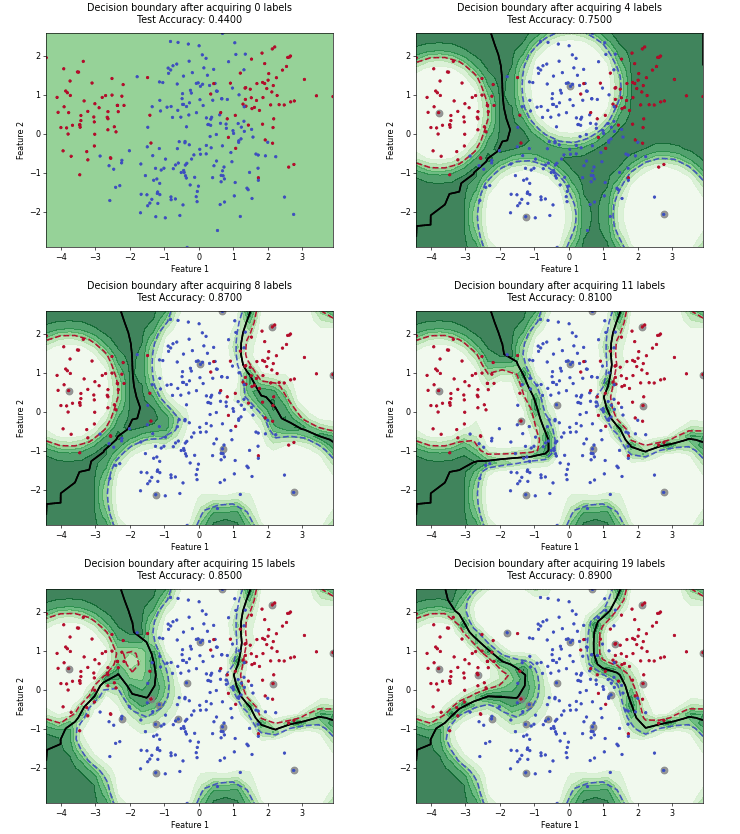
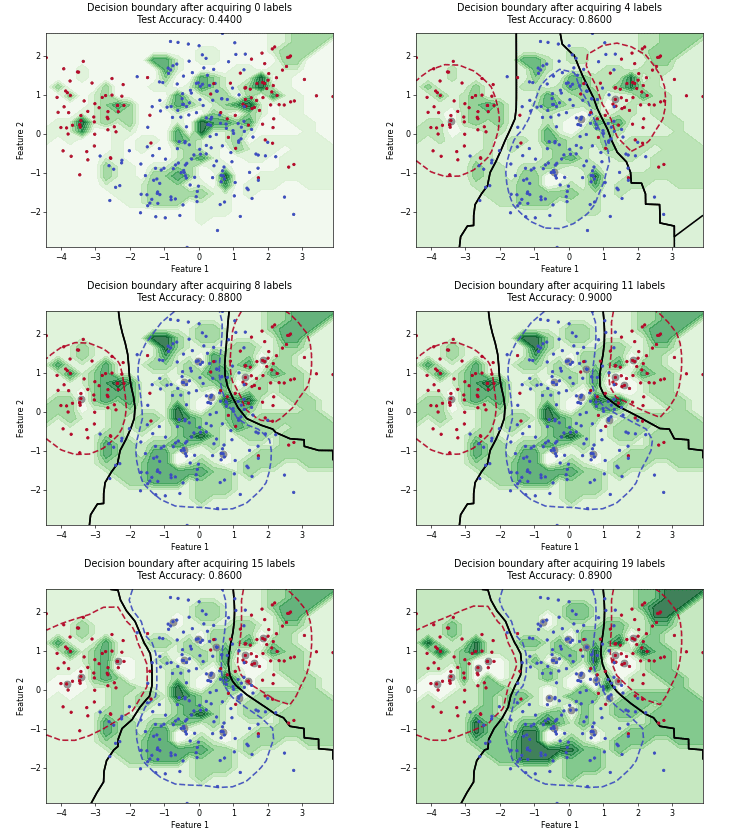
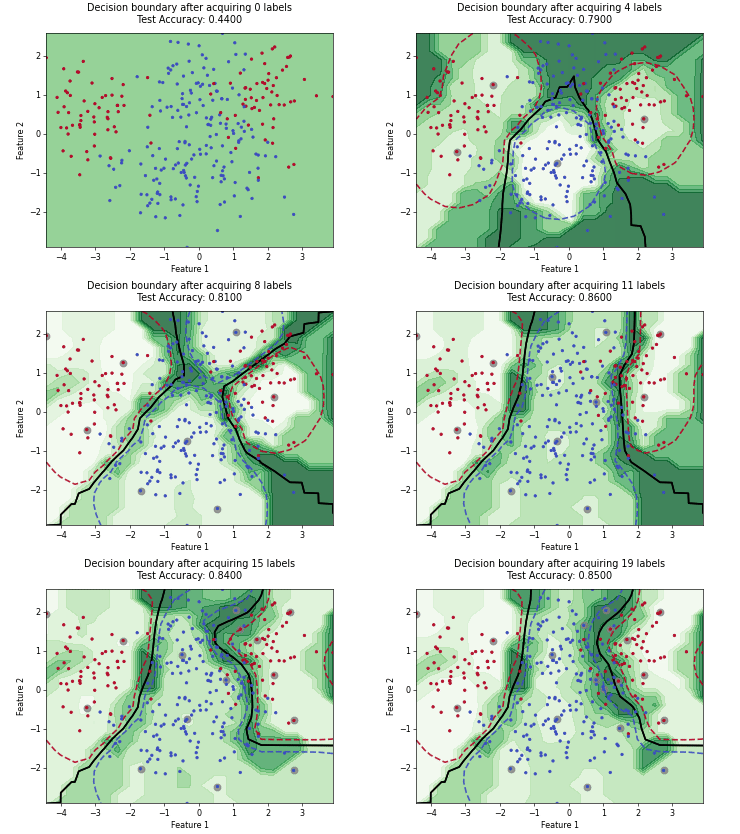
Uncertainty Sampling with Expected Average Precision (USAP)
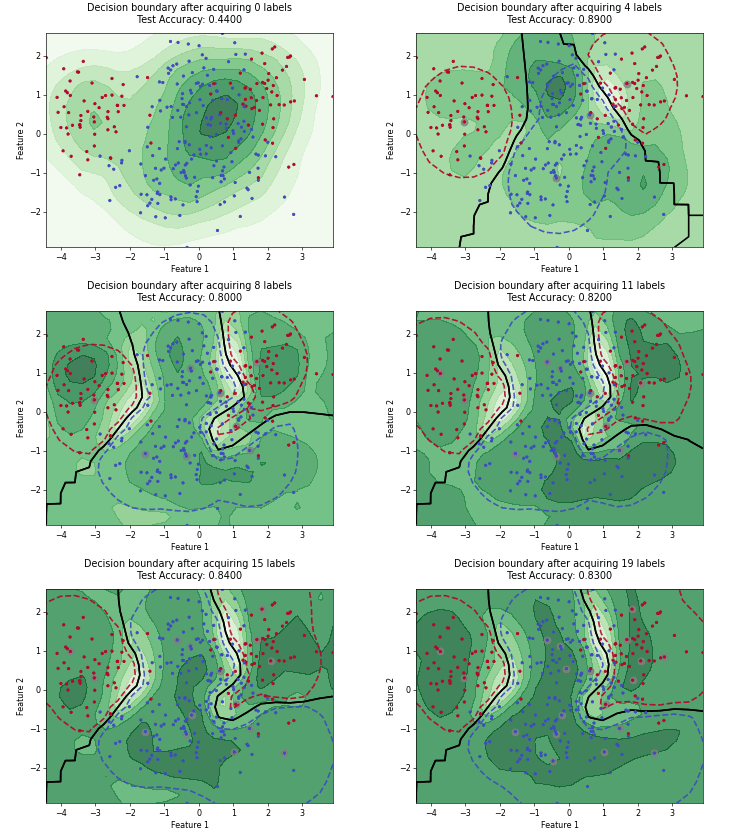
Monte-Carlo Expected Error Reduction (EER) with Log-Loss
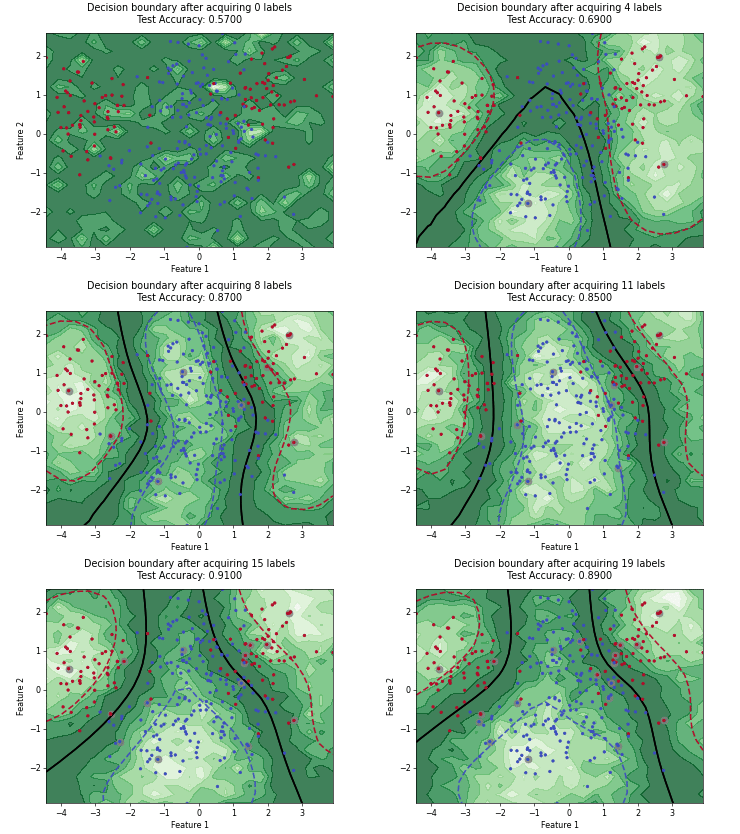
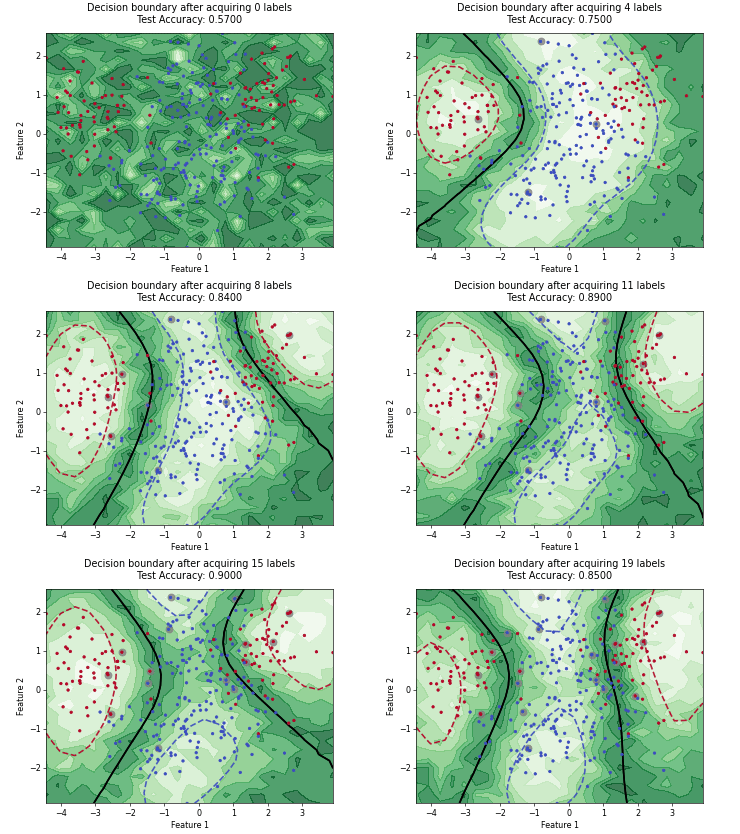
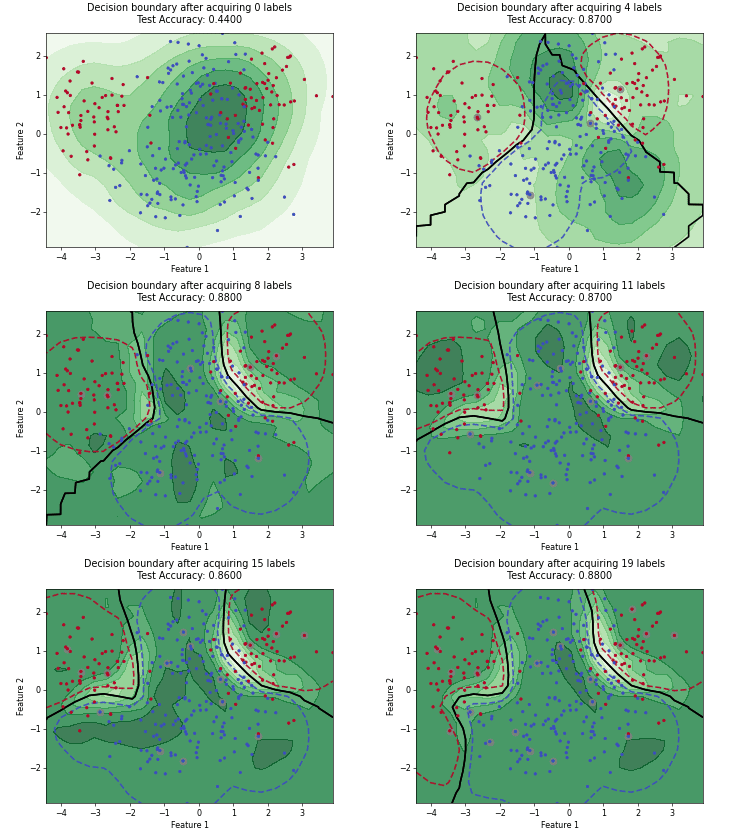
Monte-Carlo Expected Error Reduction (EER) with Misclassification-Loss
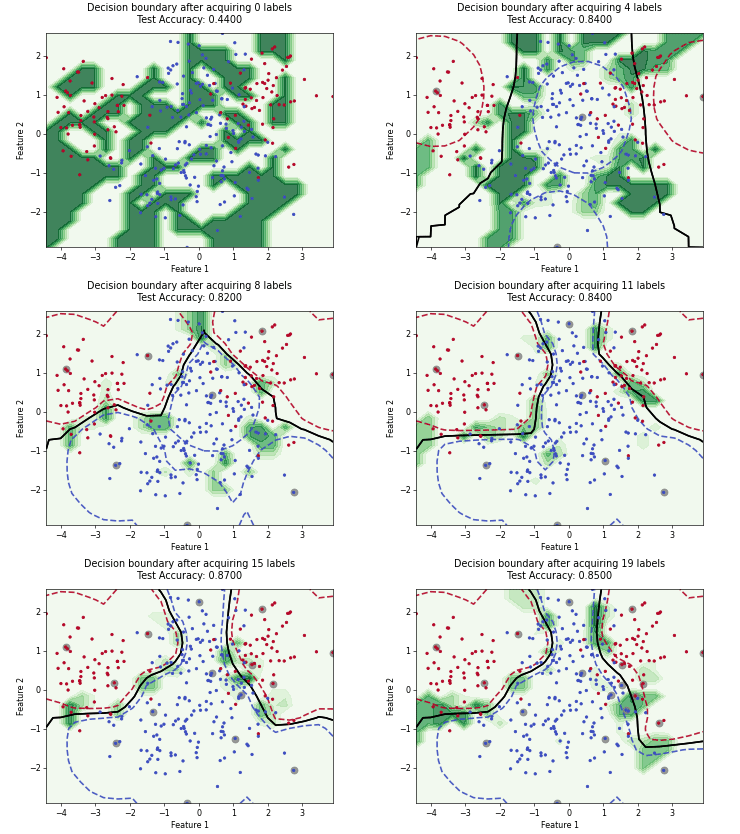
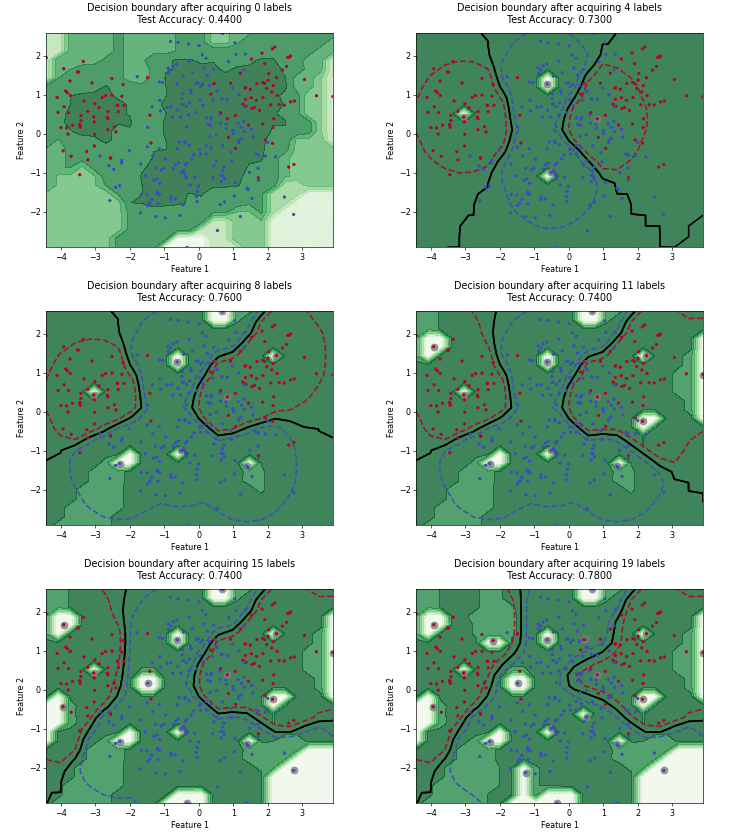
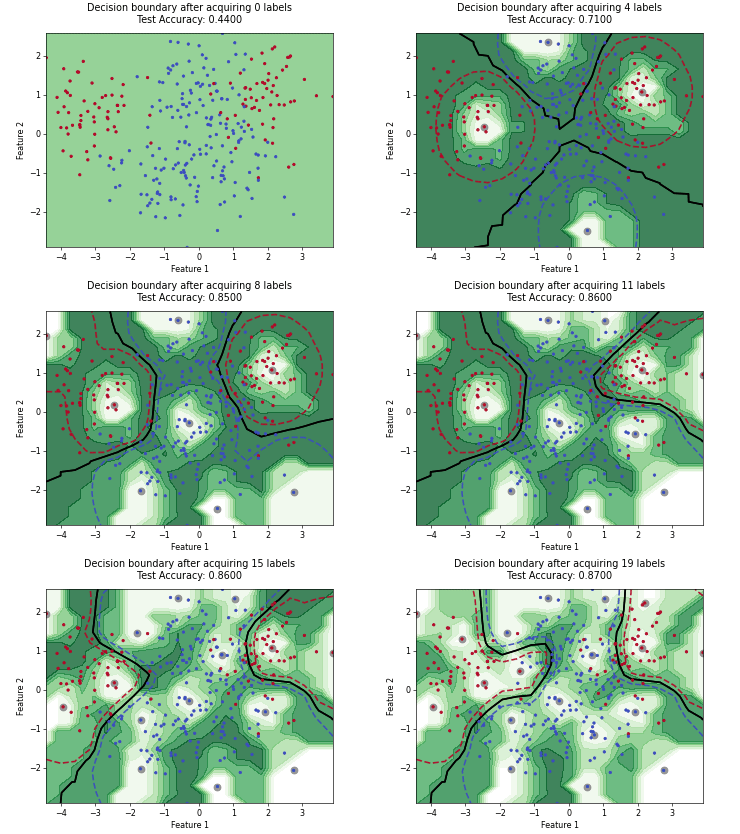
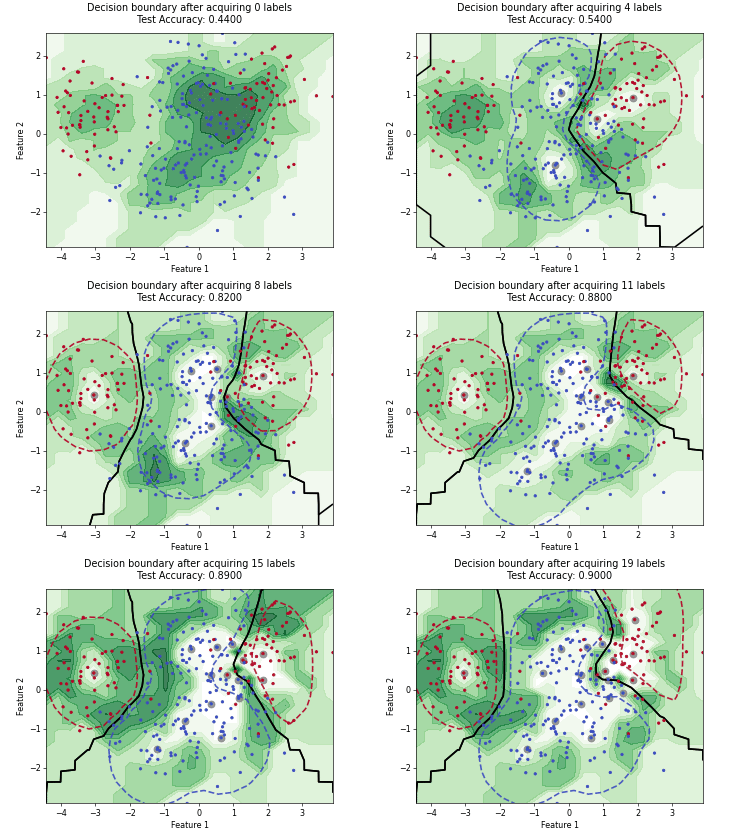
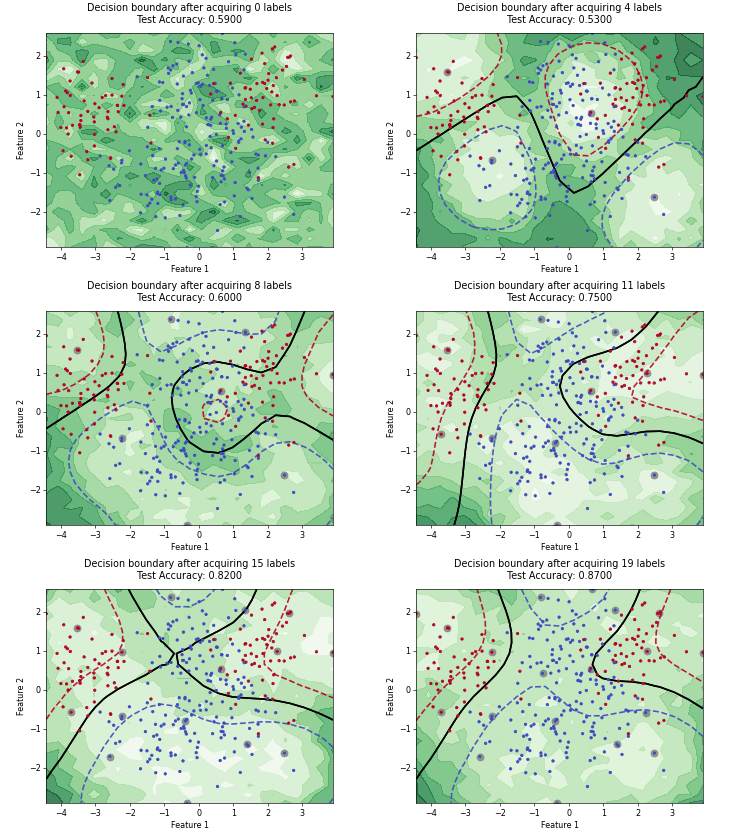
Query-by-Committee (QBC) with Kullback-Leibler Divergence
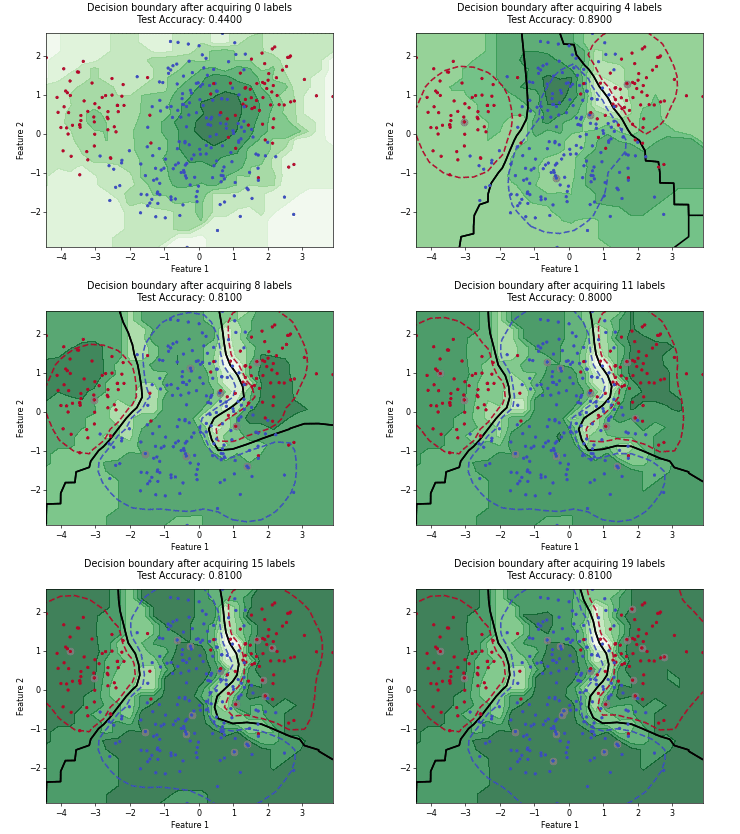
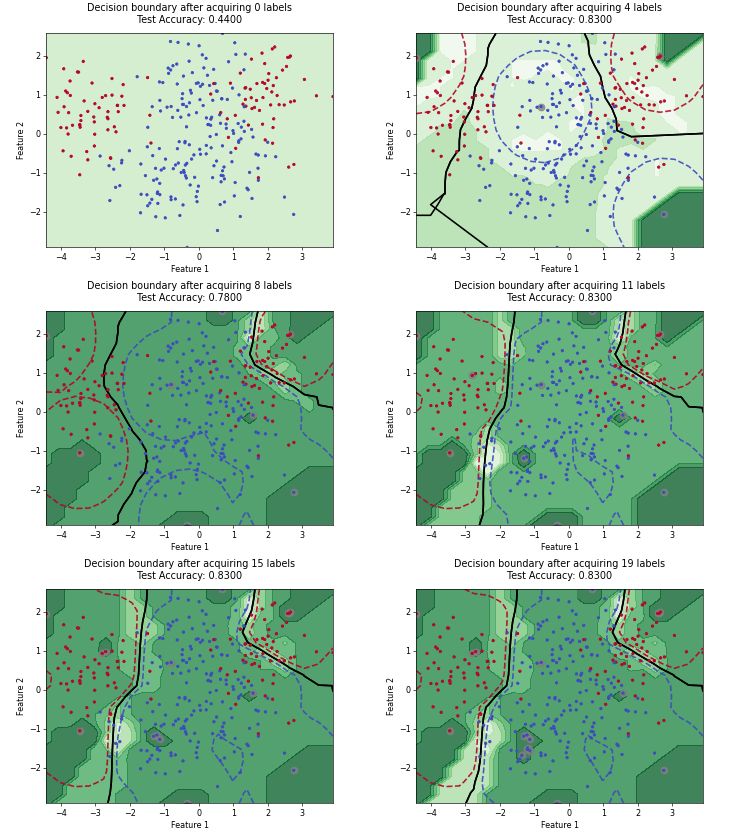
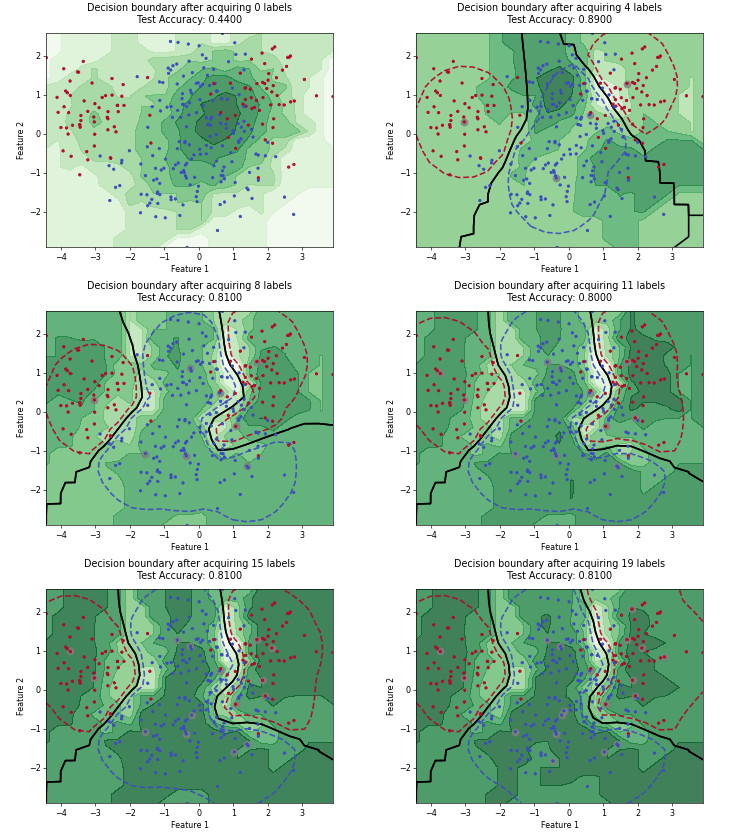
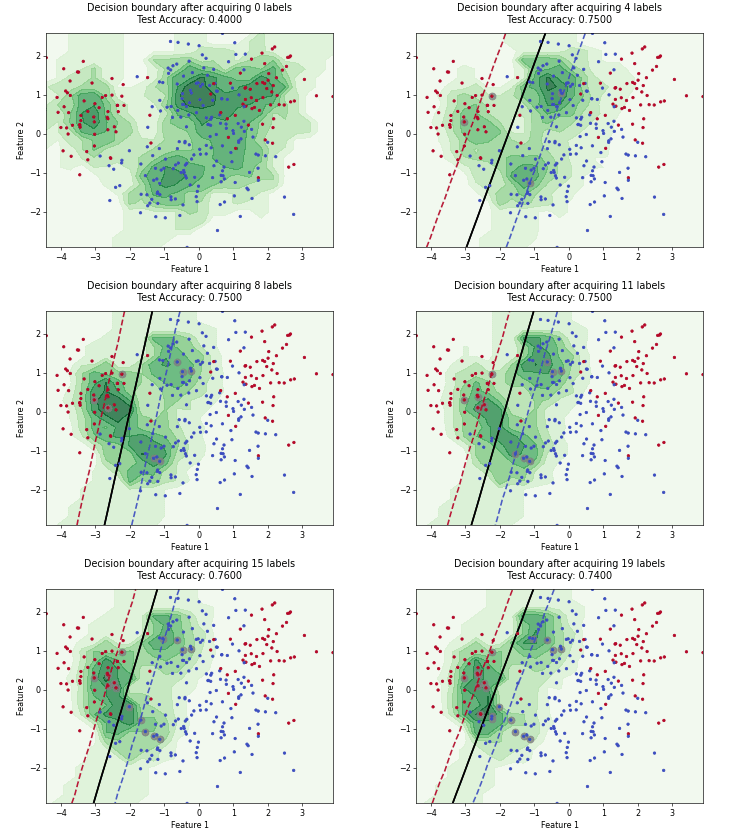
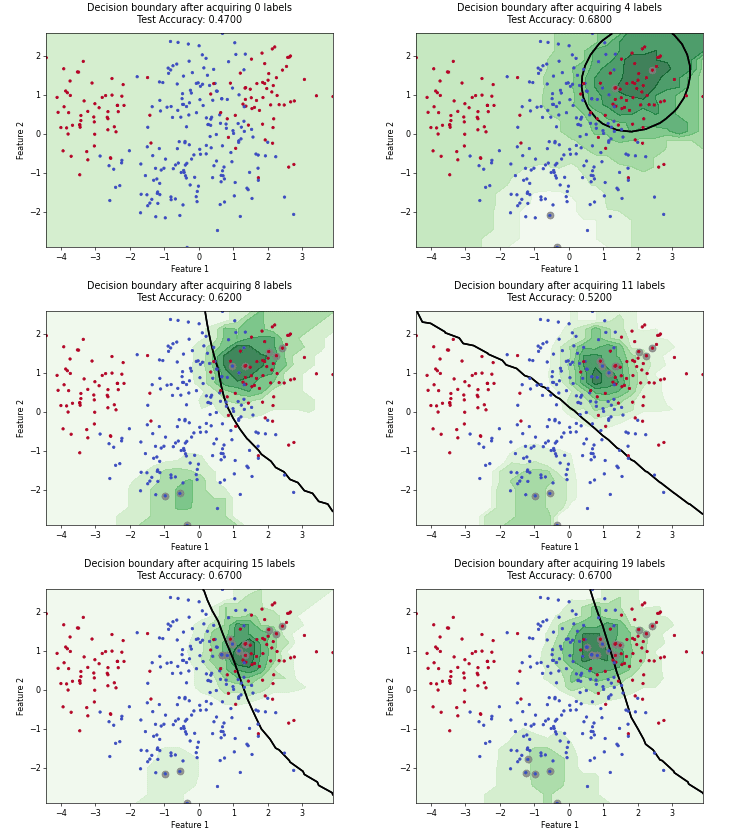
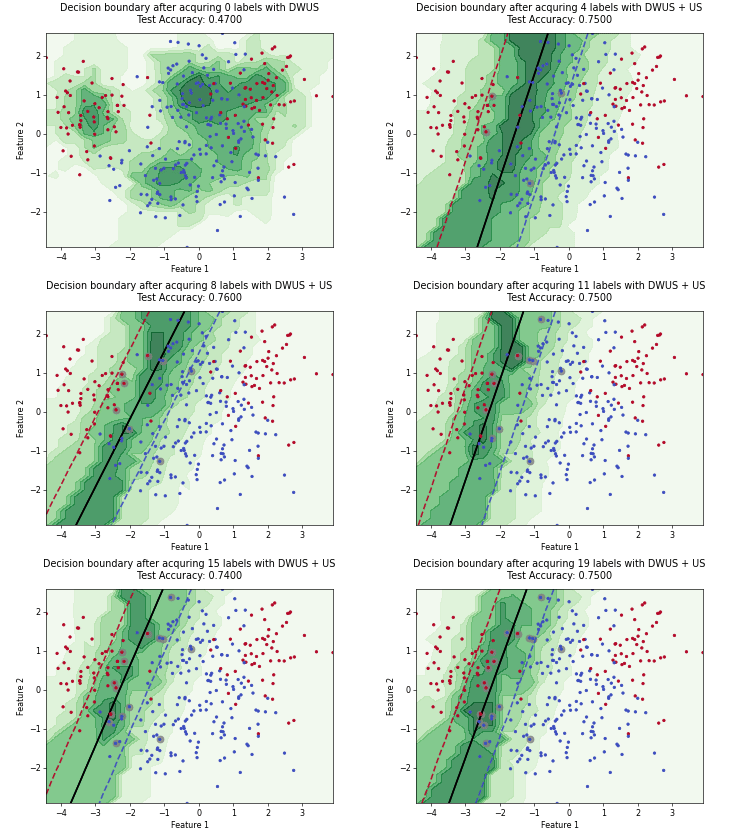
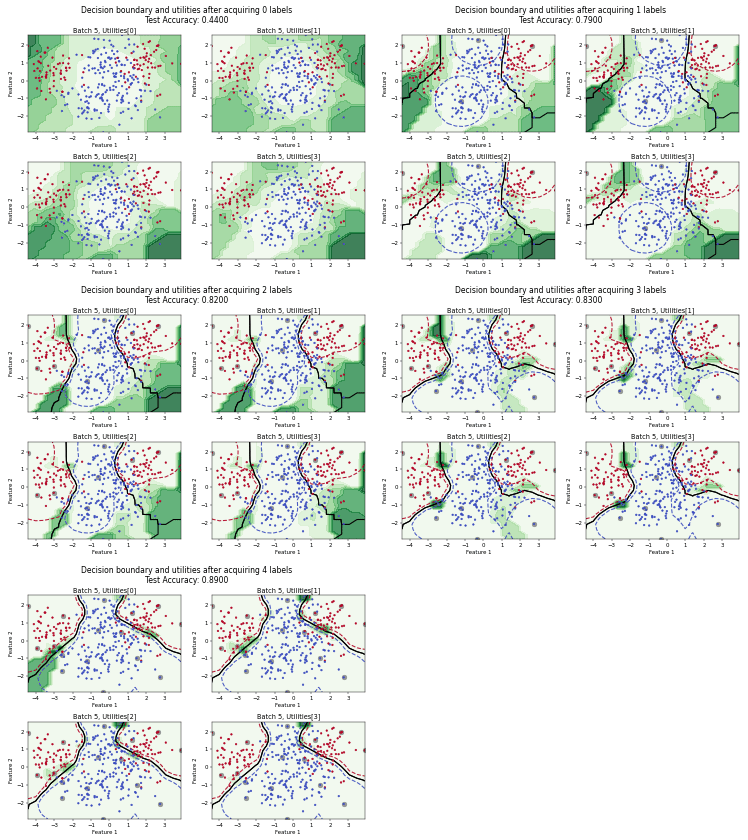
Batch Active Learning by Diverse Gradient Embedding (BADGE)
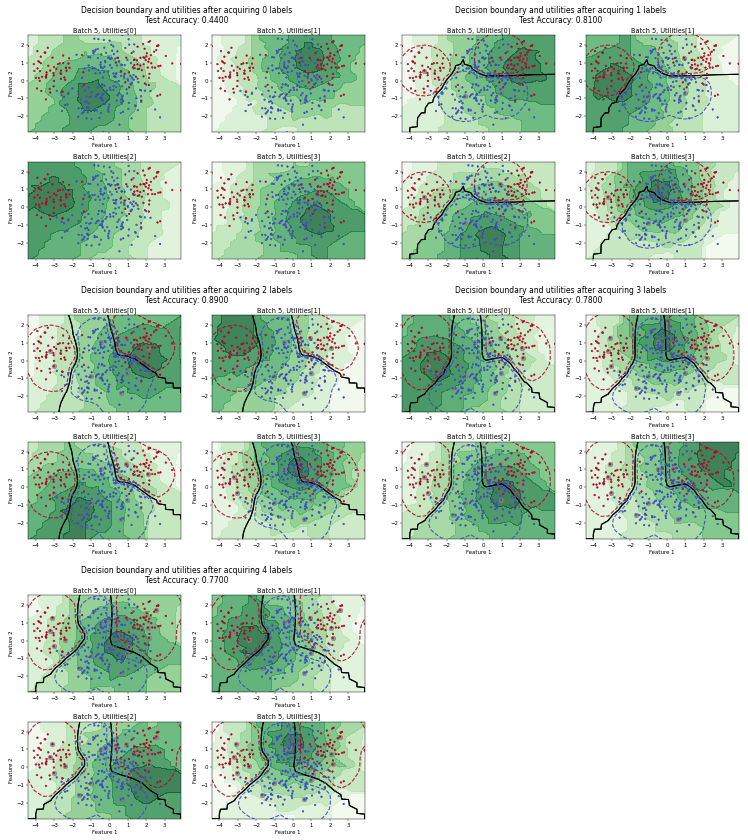
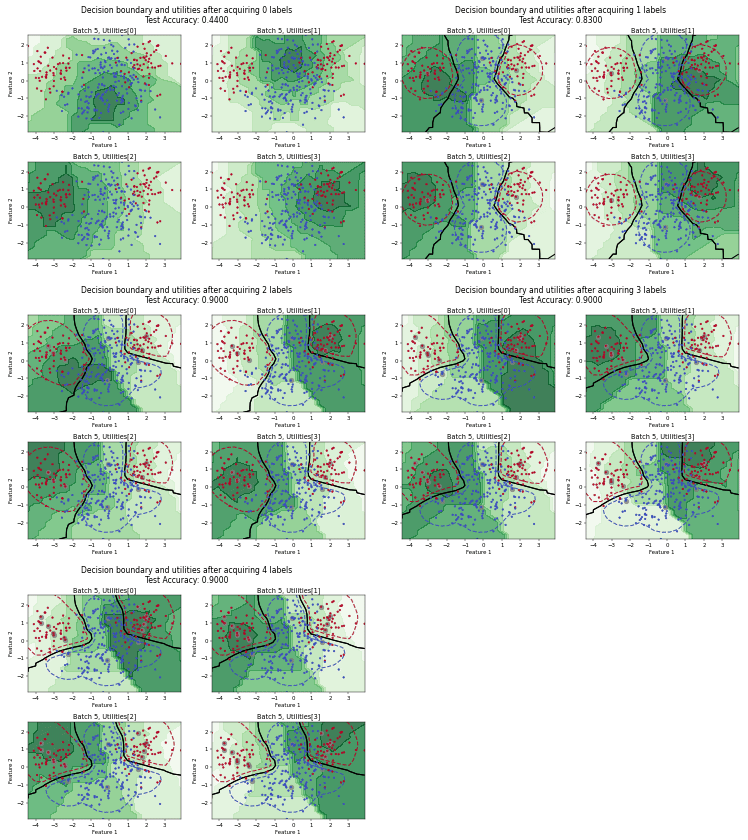
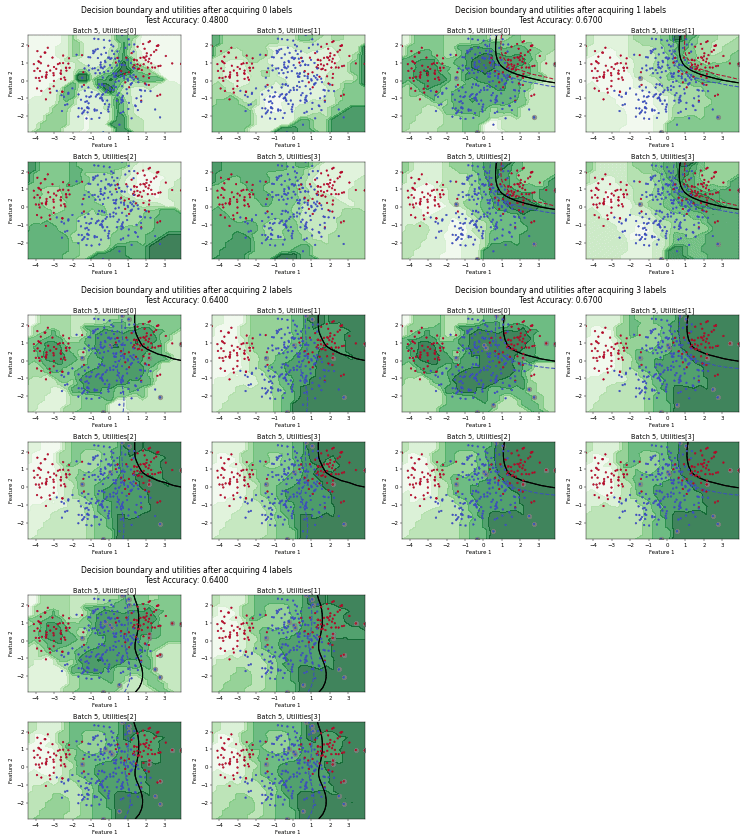
Batch Density-Diversity-Distribution-Distance Sampling (4DS)
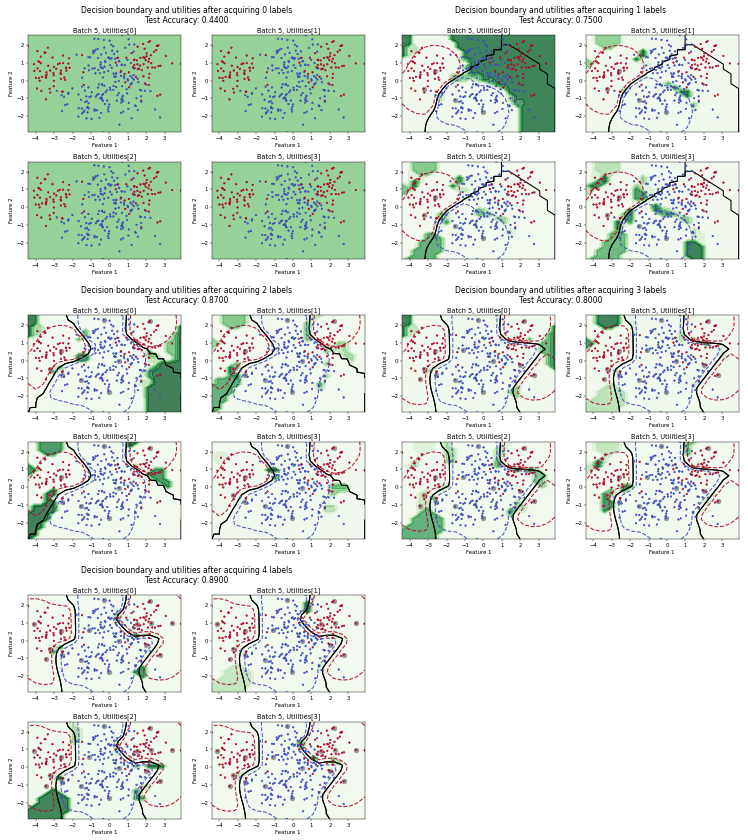
Fast Active Learning by Contrastive UNcertainty (FALCUN)
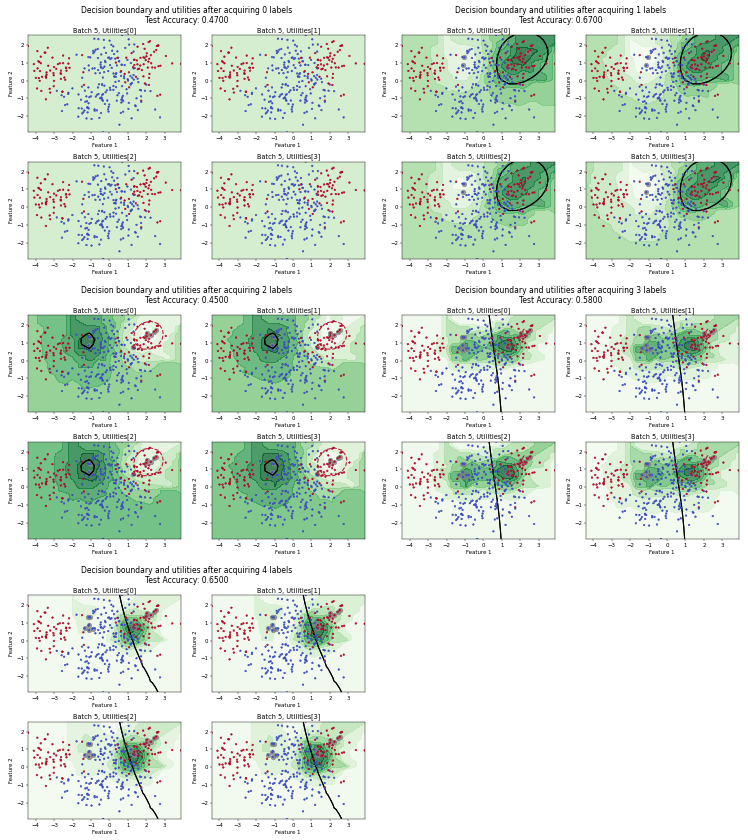
Batch Bayesian Active Learning by Disagreement (BatchBALD)
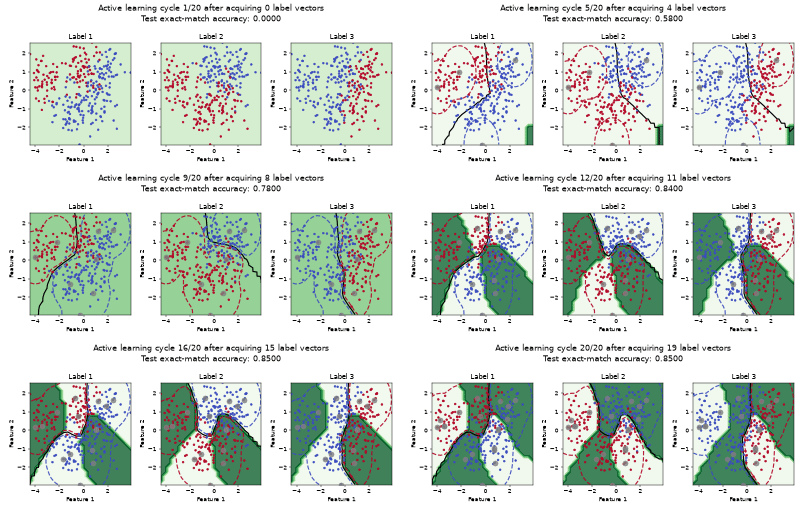
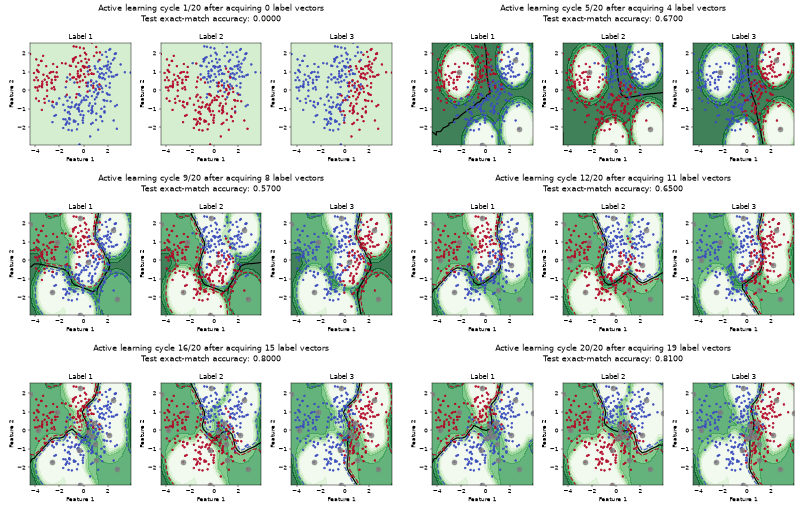
Maximum Loss Reduction with Maximal Confidence (MMC)
🏊 Pool-based Active Learning: Regression#

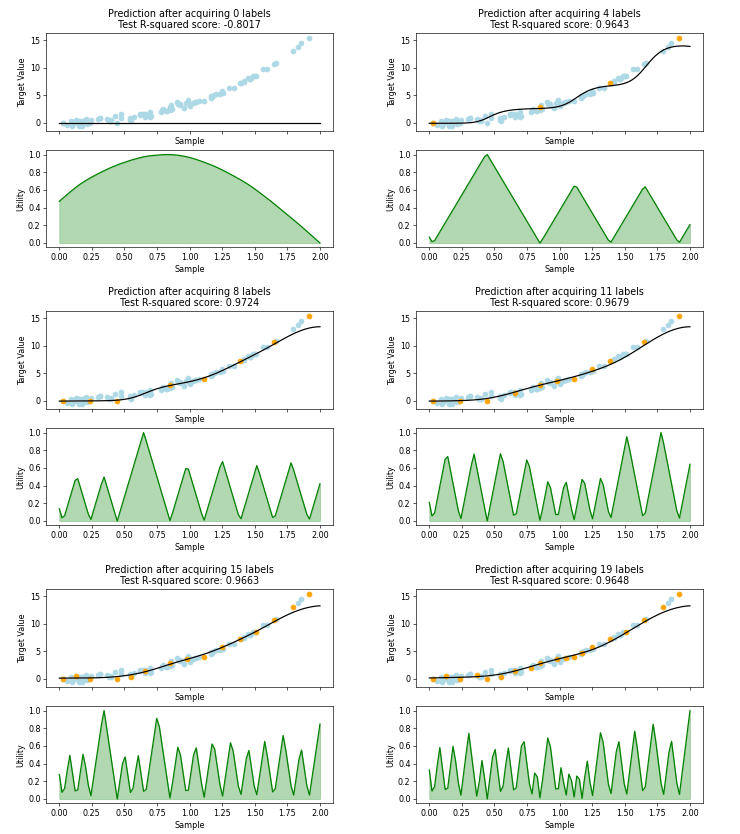
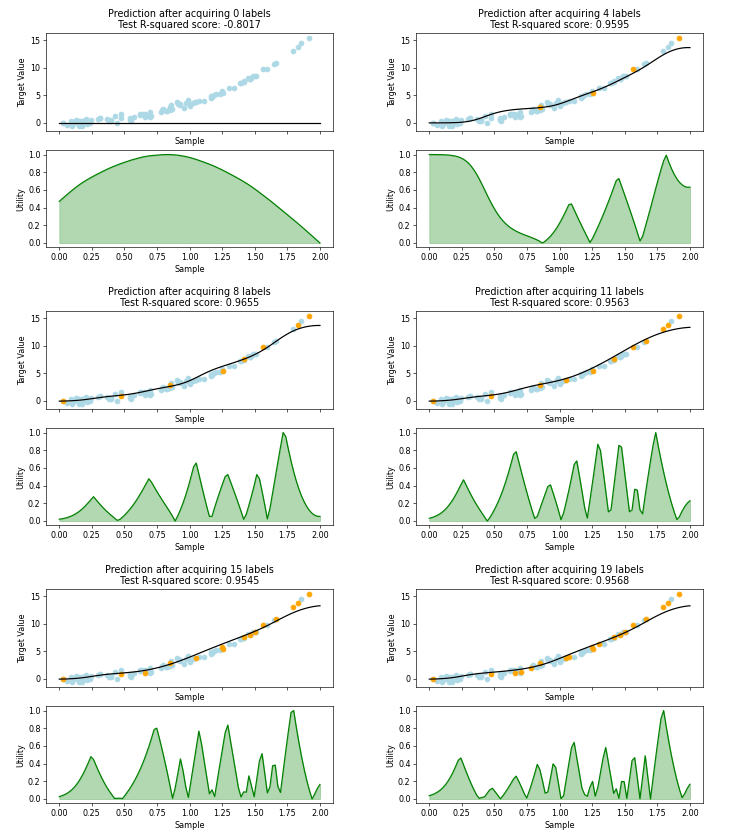
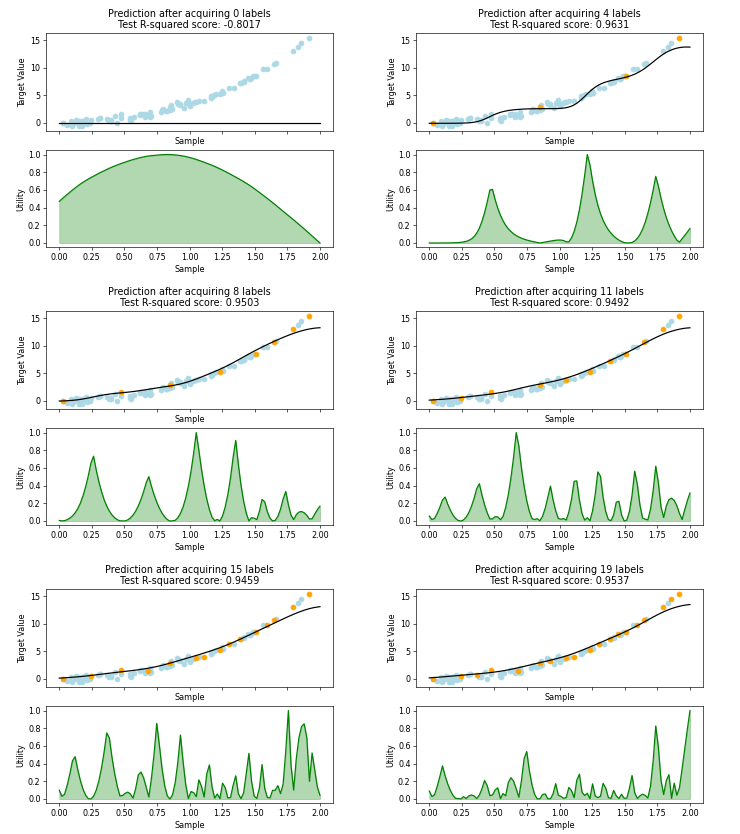
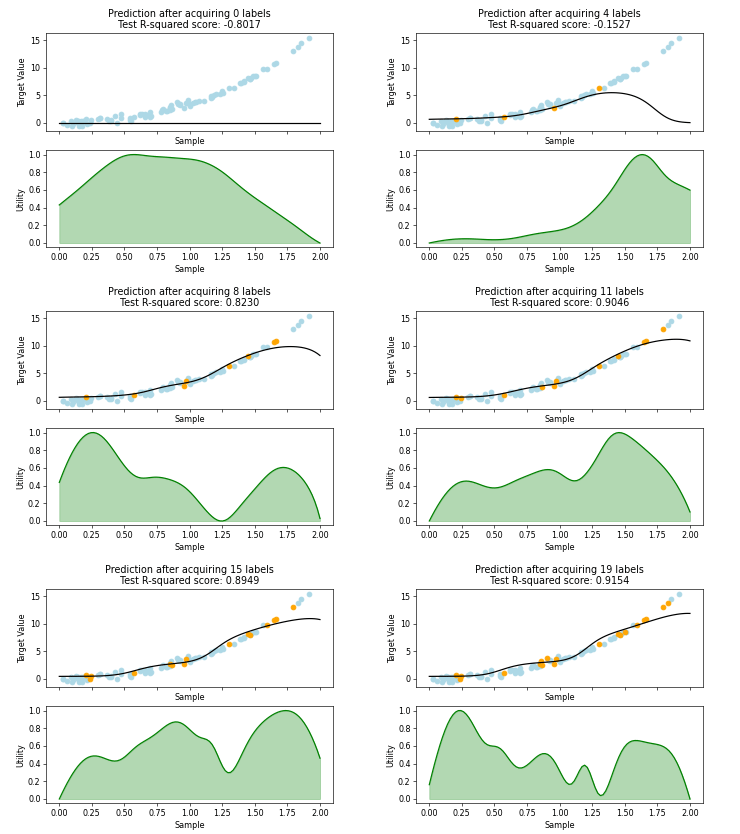
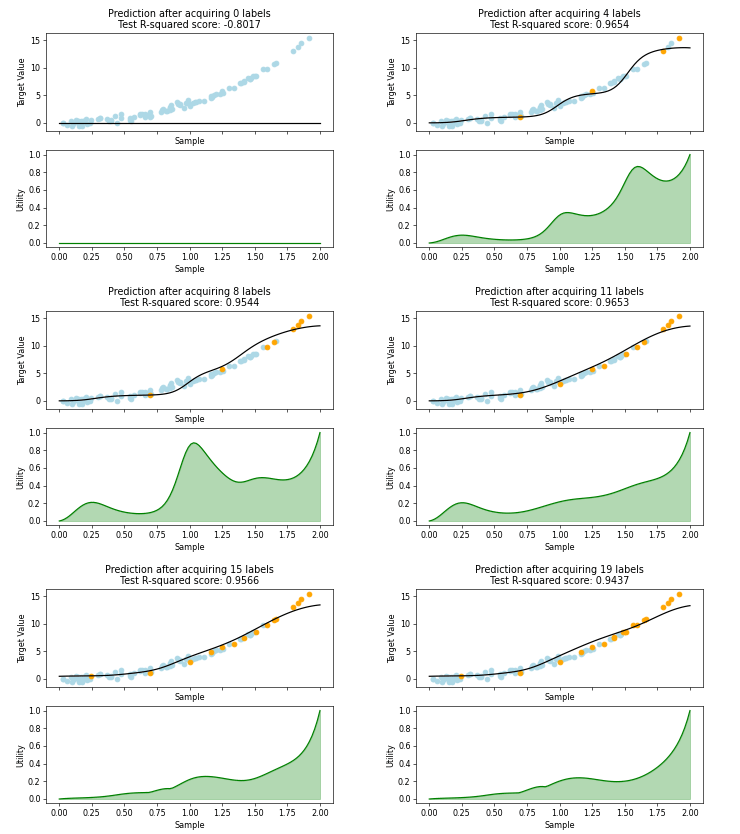
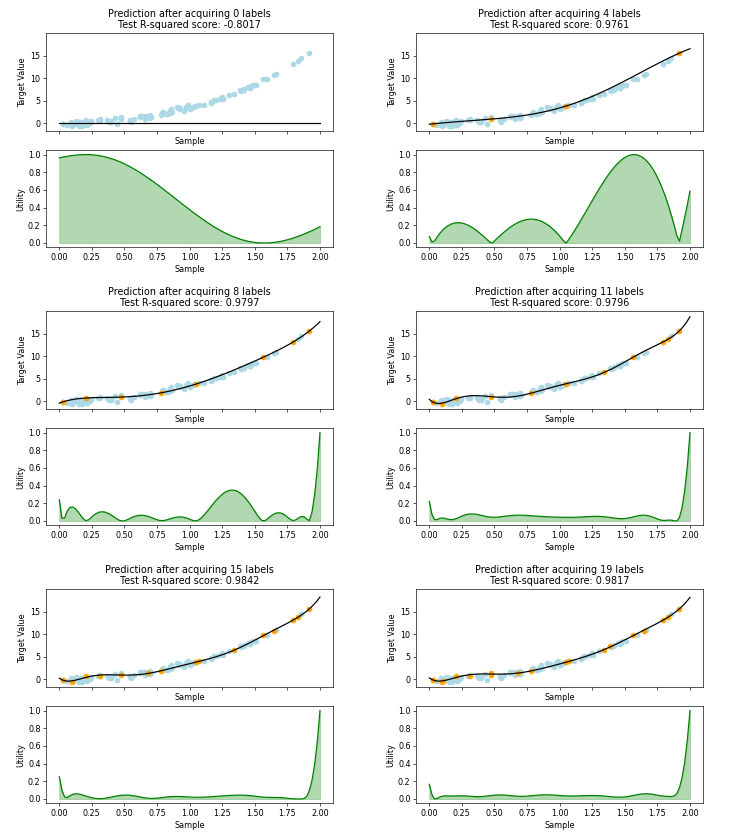
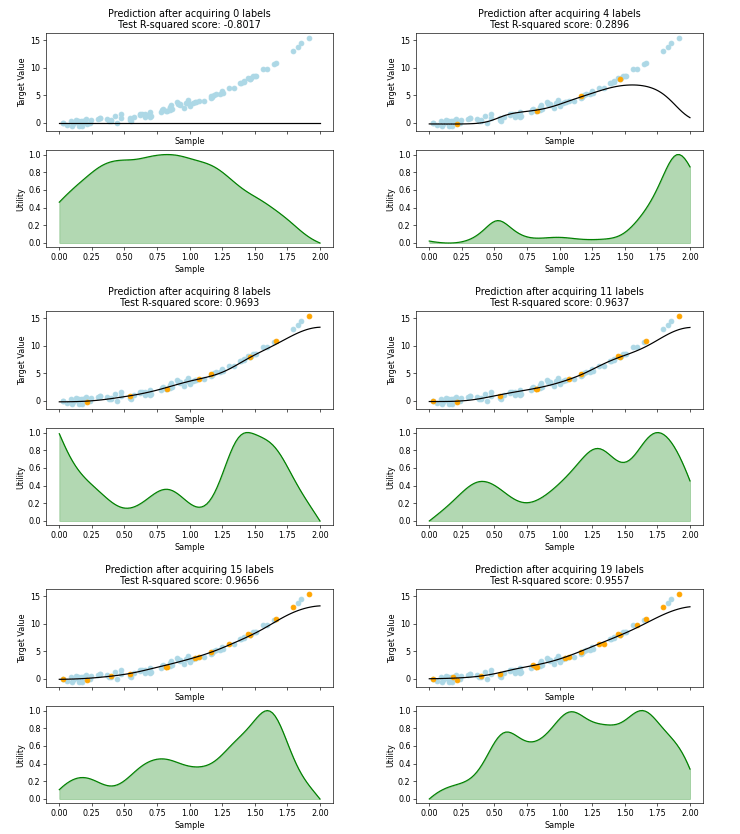
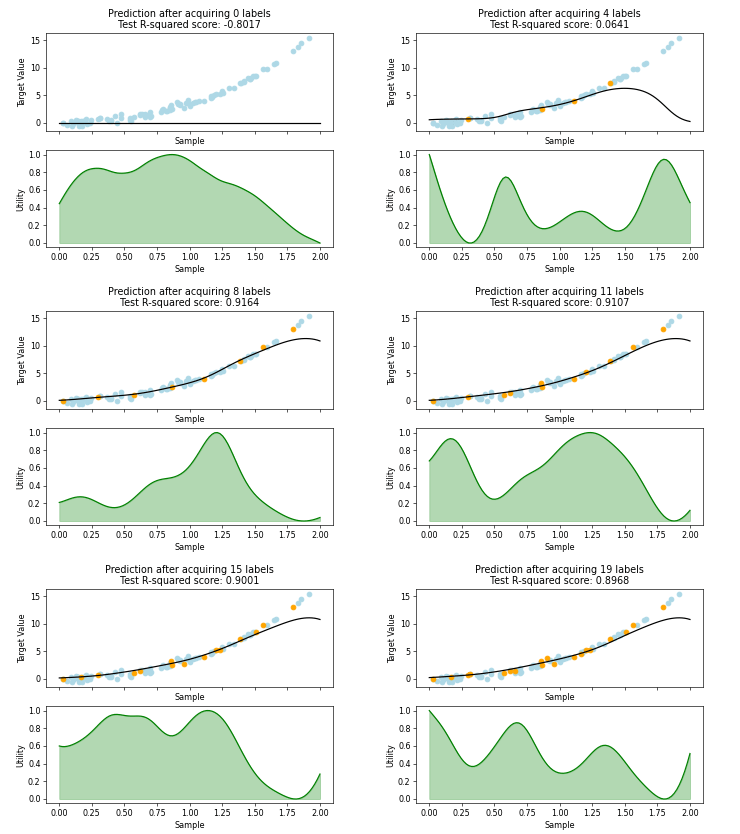
Regression based Kullback Leibler Divergence Maximization
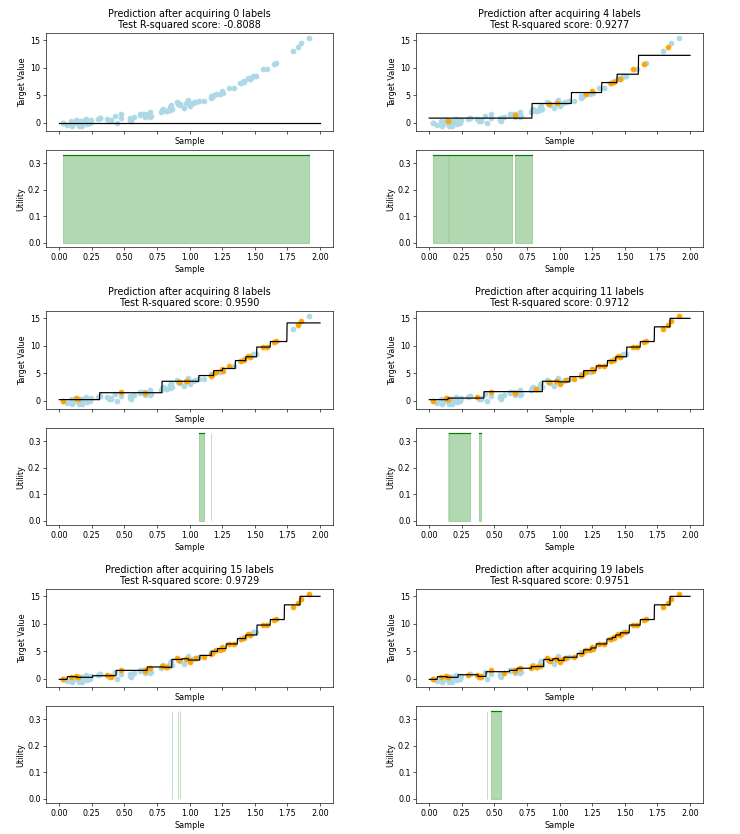
Regression Tree Based Active Learning (RT-AL) with Random Selection
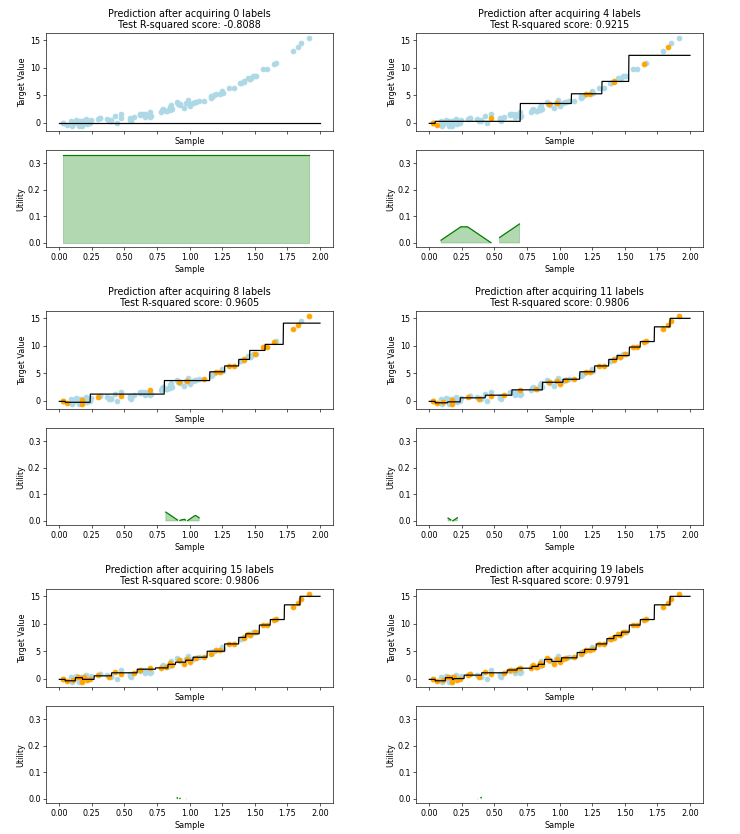
Regression Tree Based Active Learning (RT-AL) with Diversity Selection
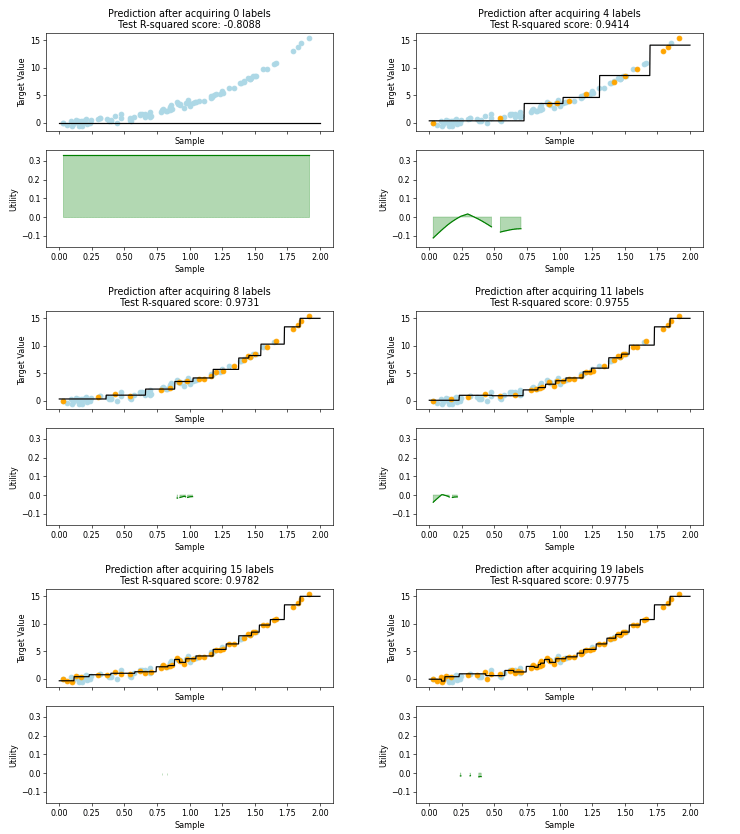
Regression Tree Based Active Learning (RT-AL) with Representativity Selection
🏊 Pool-based Active Learning: Multi-annotator Learning#

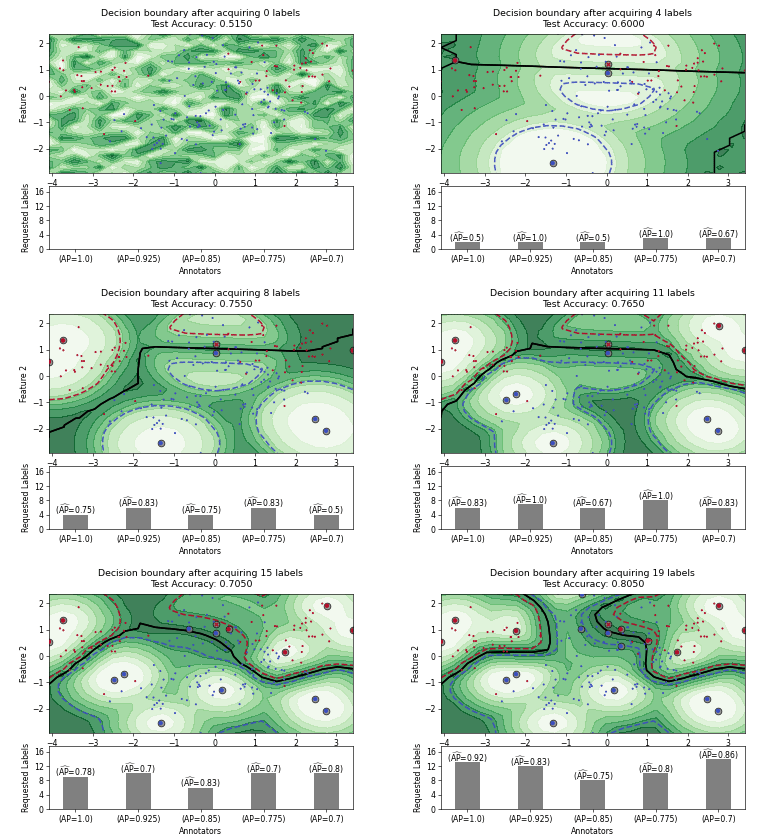
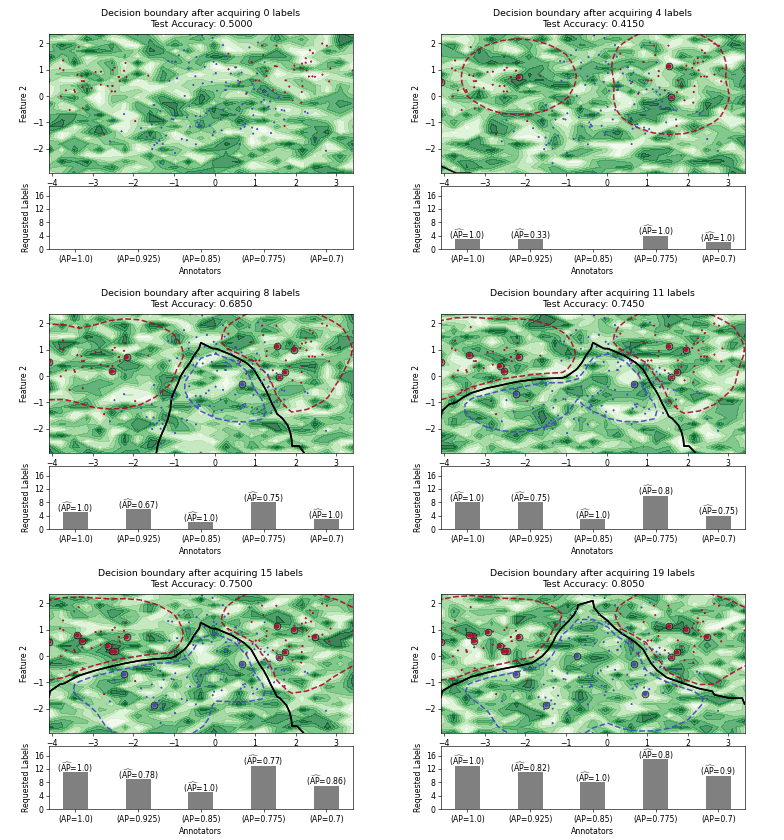
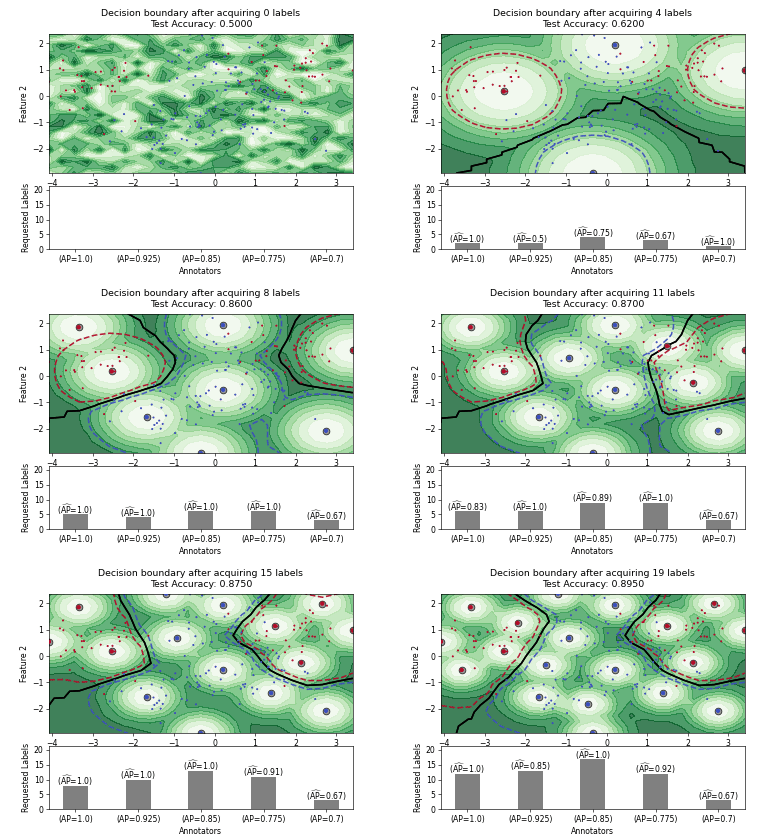
🌊 Stream-based Active Learning: Classification#

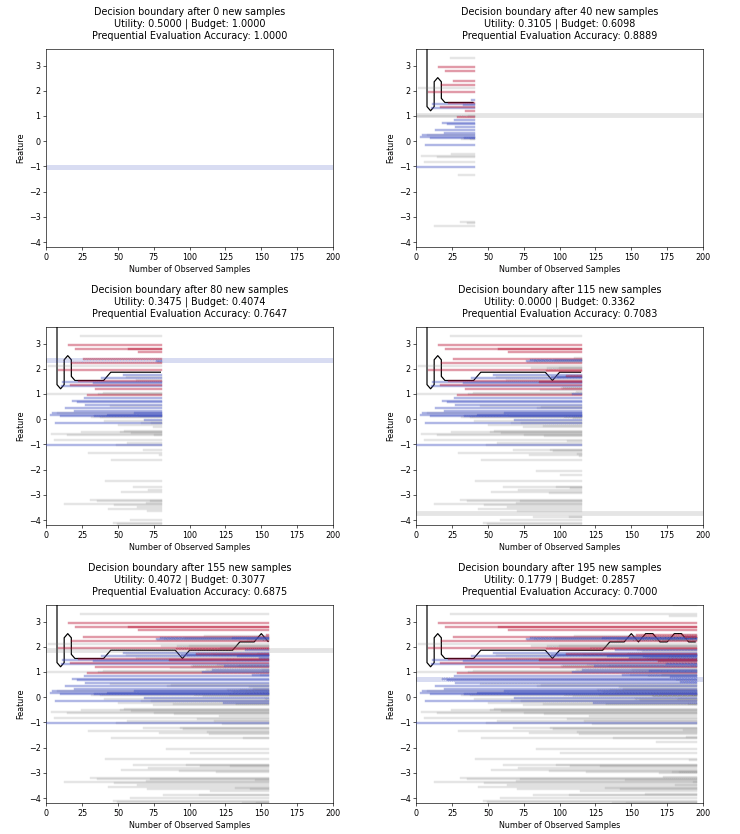
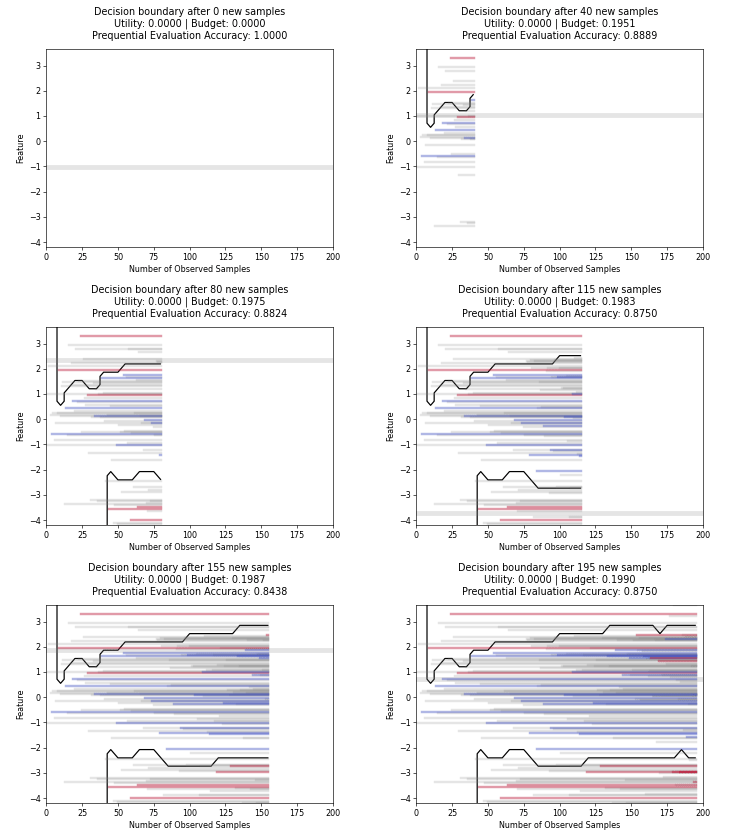
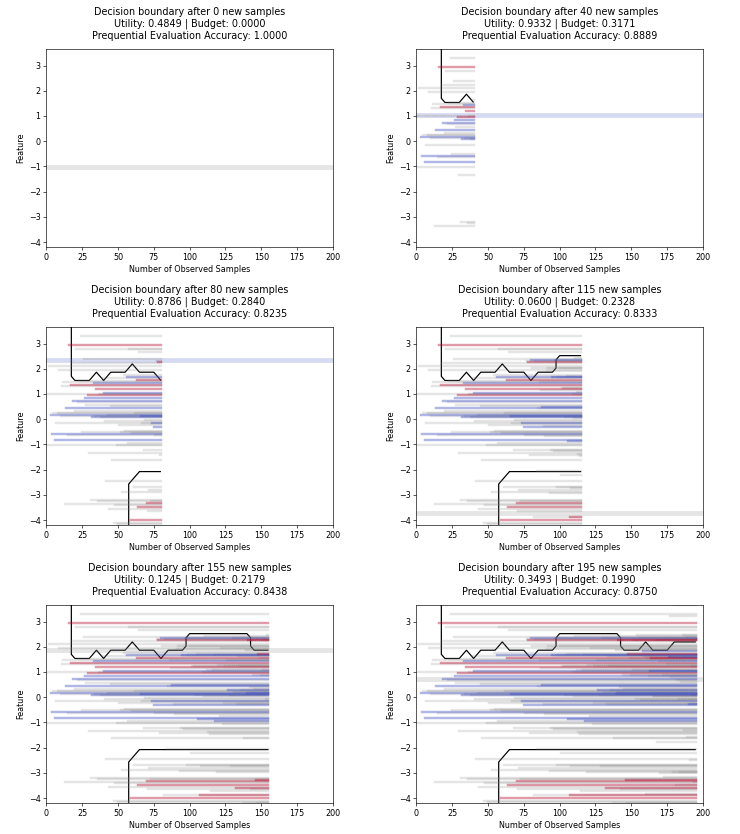
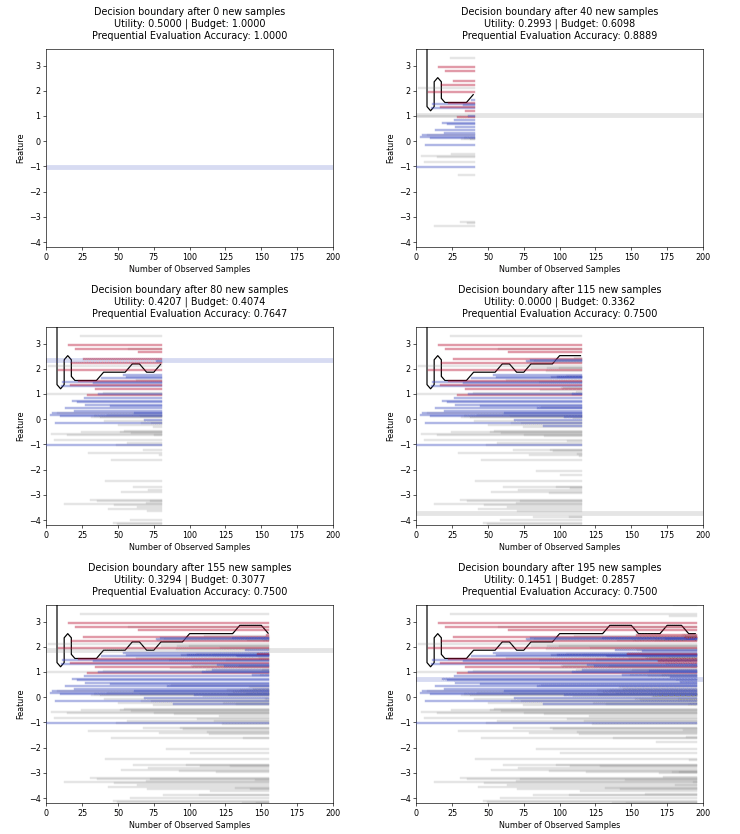
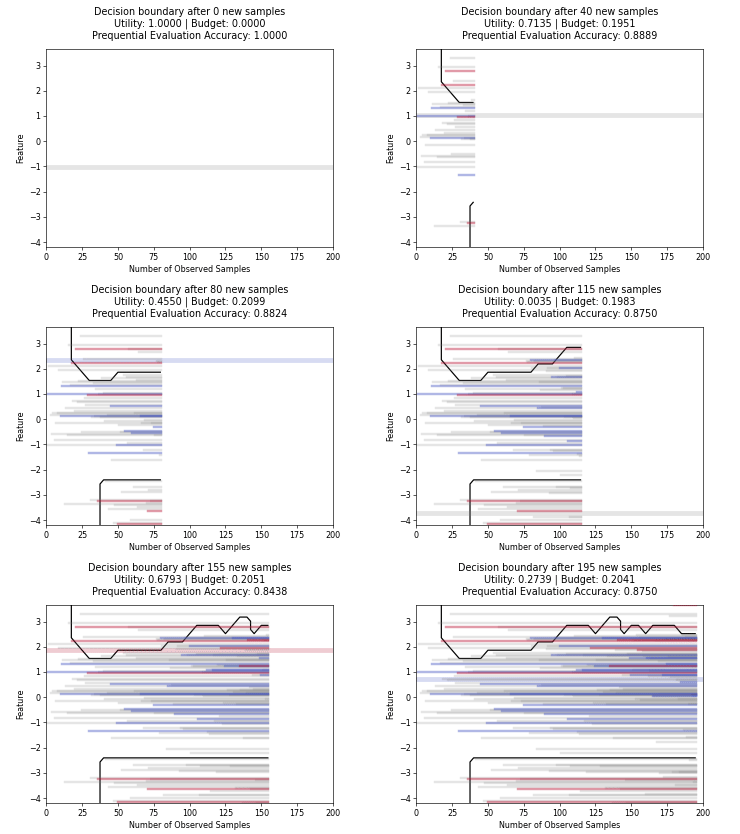
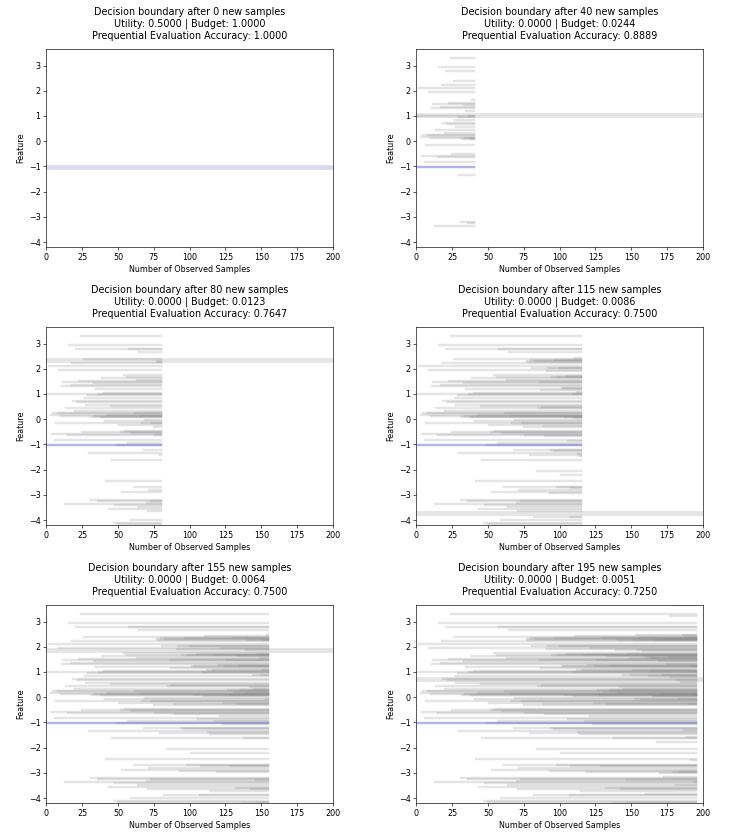
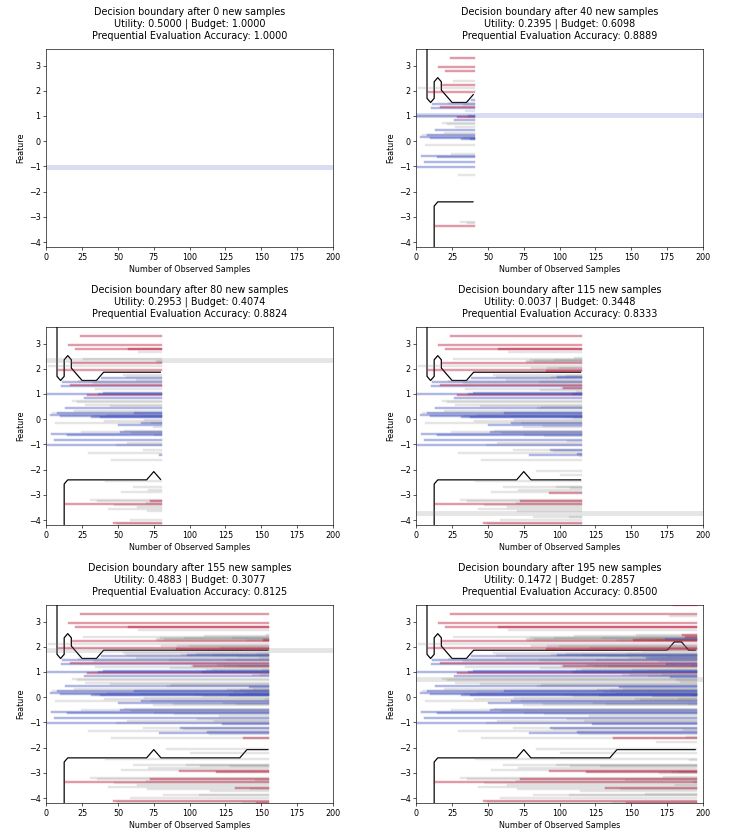
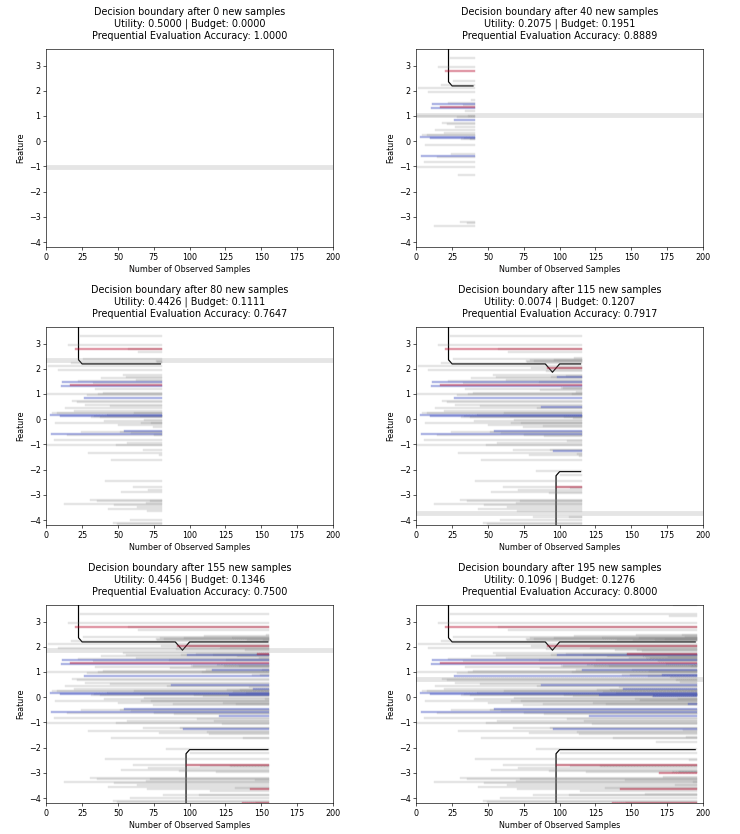
Cognitive Dual-Query Strategy with Random Sampling
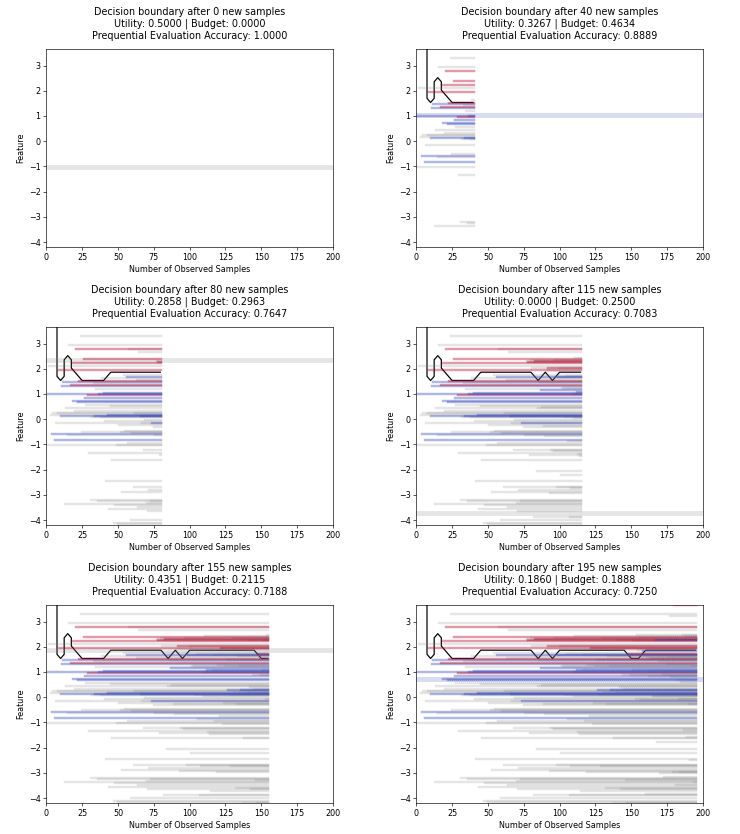
Cognitive Dual-Query Strategy with Variable-Uncertainty
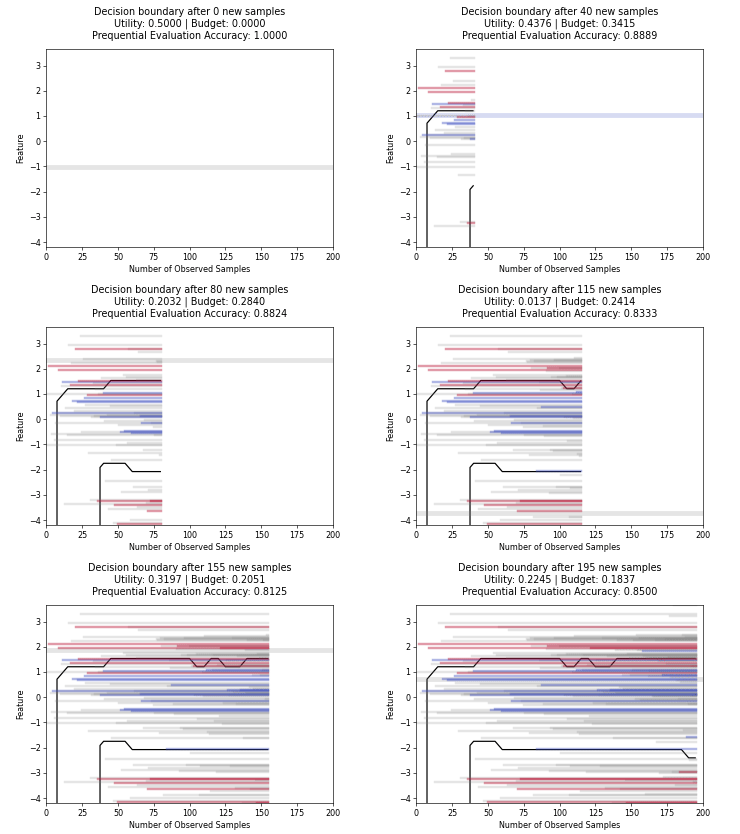
Cognitive Dual-Query Strategy with Randomized-Variable-Uncertainty
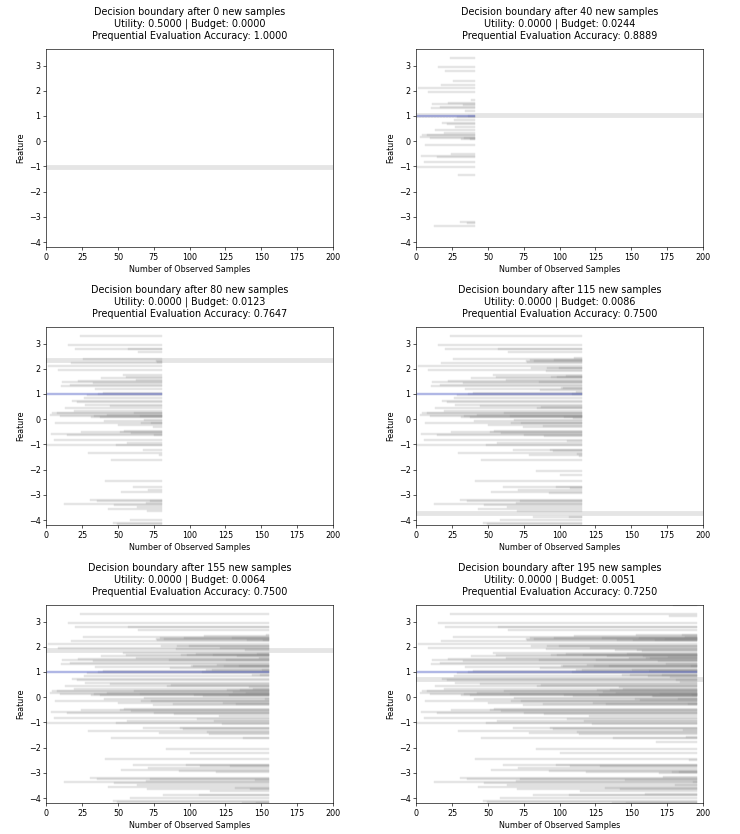
Cognitive Dual-Query Strategy with Fixed-Uncertainty