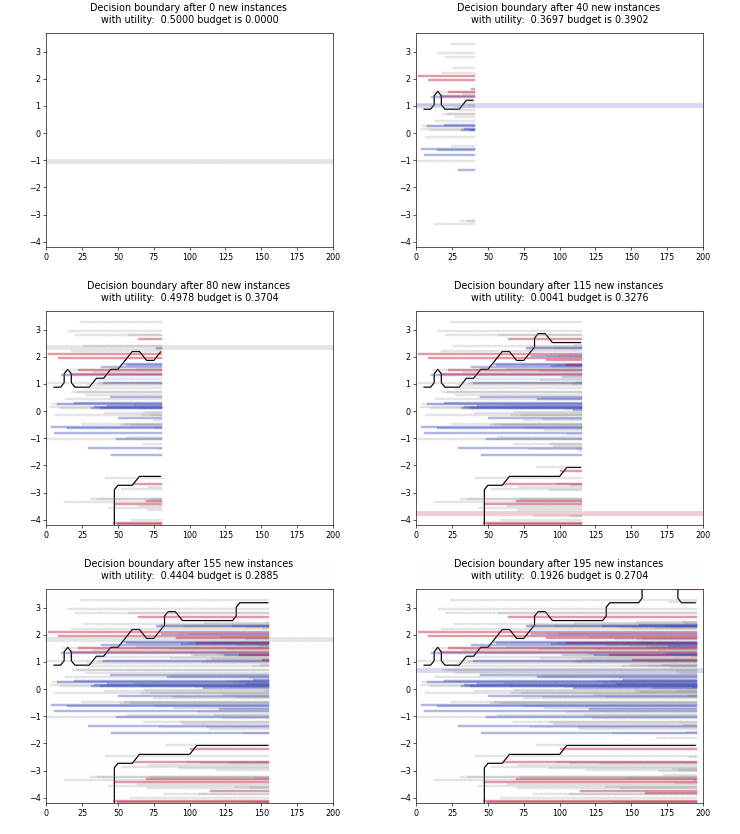
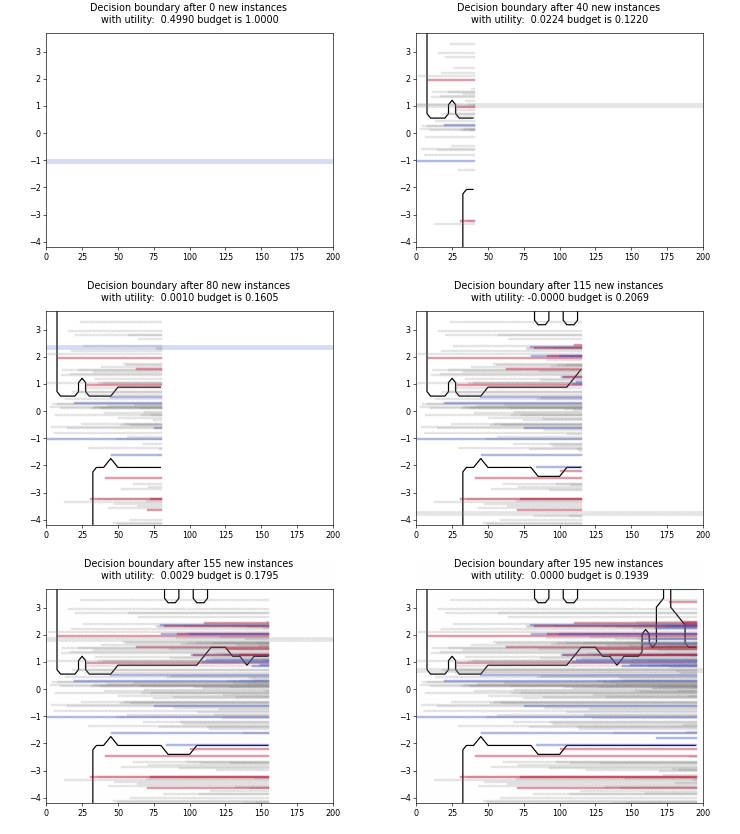
skactiveml.visualization.plot_stream_training_data#
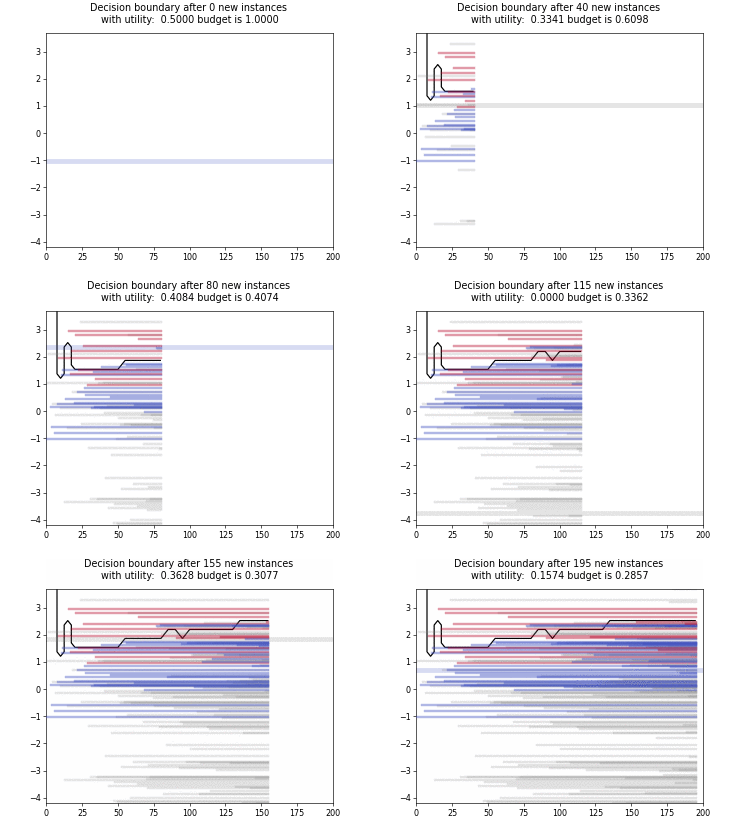
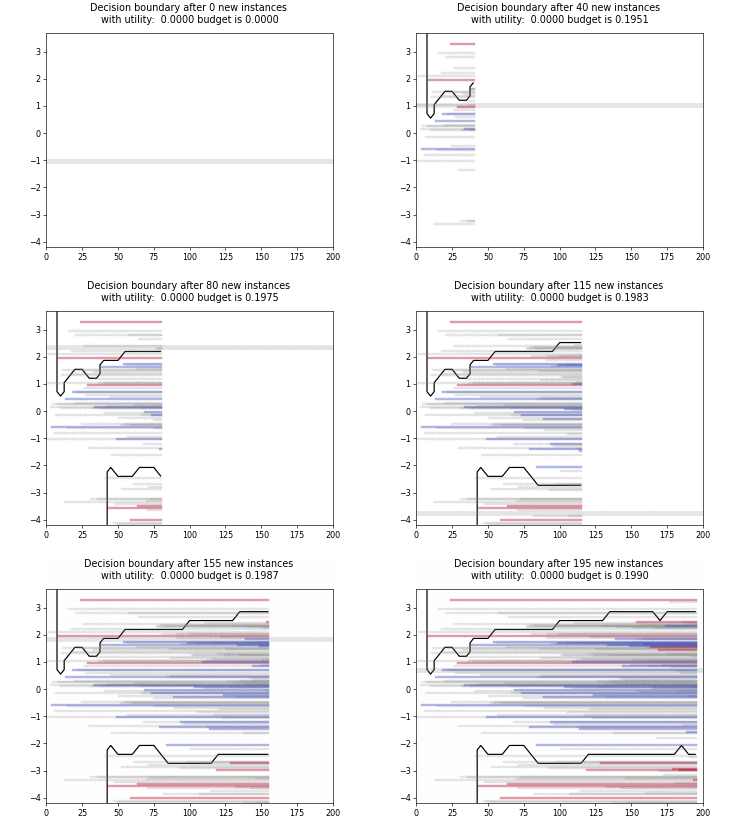
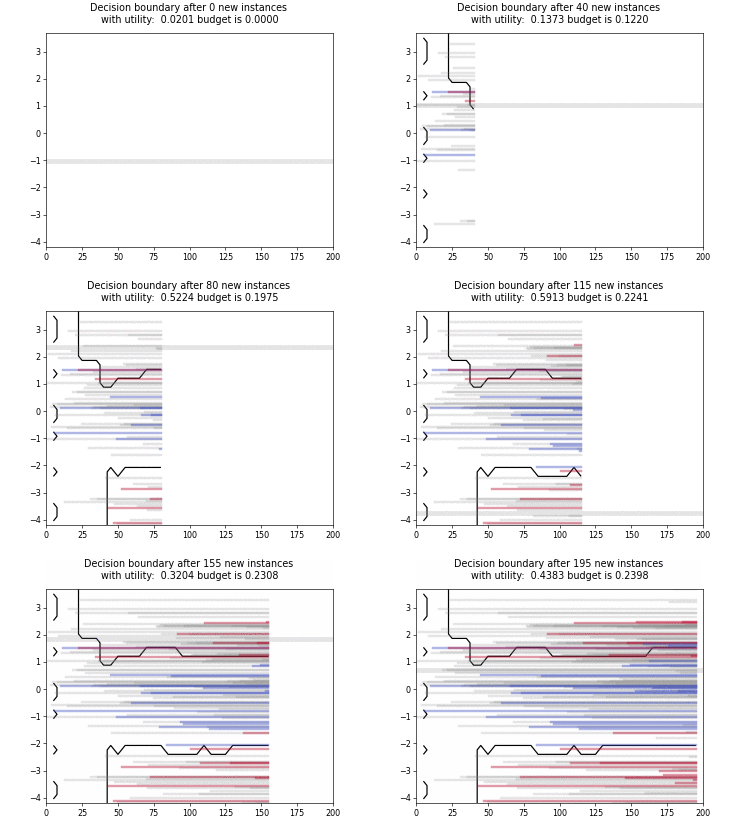
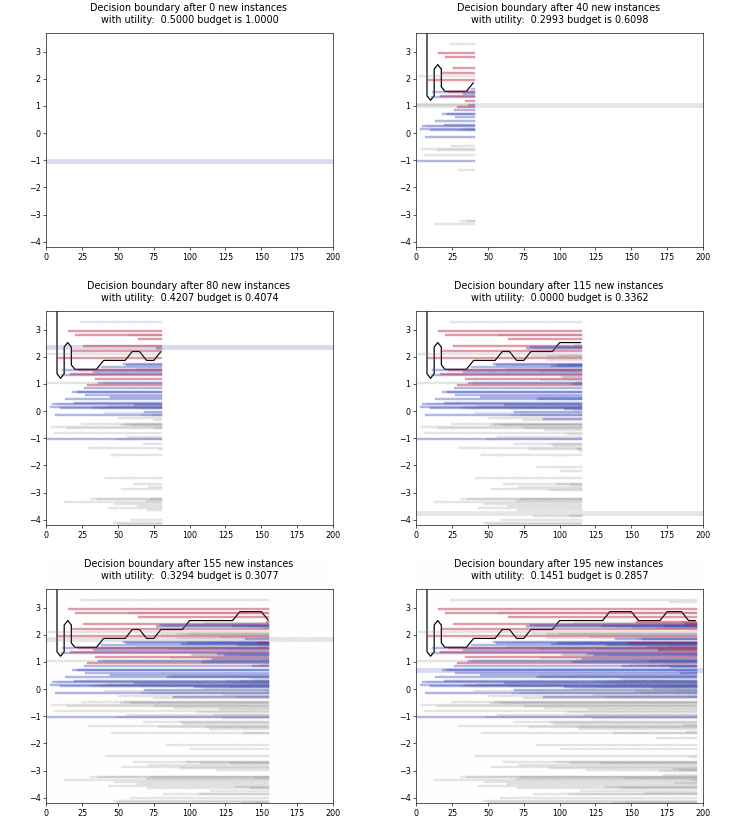
- skactiveml.visualization.plot_stream_training_data(ax, X, y, queried_indices, classes, feature_bound, unlabeled_color='grey', cmap='coolwarm', alpha=0.2, linewidth=3, plot_cand_highlight=True)[source]#
Plot the utility for the given query strategy.
- Parameters
- axmatplotlib.axes.Axes
The axis on which the utility is plotted. Only if y.ndim = 1 (single annotator).
- Xarray-like of shape (n_samples, 1)
Training data set, usually complete, i.e. including the labeled and unlabeled samples.
- yarray-like of shape (n_samples, )
Labels of the training data set (possibly including unlabeled ones indicated by self.MISSING_LABEL).
- queried_indicesarray-like of shape (n_samples,)
Indicates which instances from candidates have been queried.
- classesarray-like of shape (n_classes)
Holds the label for each class.
- feature_boundarray-like of shape [[xmin, ymin], [xmax, ymax]]
Determines the area in which the boundary is plotted. If candidates is not given, bound must not be None. Otherwise, the bound is determined based on the data.
- unlabeled_color: str | matplotlib.colors.Colormap, optional
- (default=’grey’)
The color for the unlabled samples.
- cmap: str | matplotlib.colors.Colormap, optional (default=’coolwarm_r’)
The colormap for the confidence levels.
- alpha: scalar
Set the alpha value used for blending - not supported on all backends.
- linewidth: float
Set the line width in points.
- plot_cand_highlight: bool
The indicator to higlight the current candidate.
- Returns
- axesarray-like of shape (n_annotators_to_plot,)
The axes on which the utilities were plotted.
Examples using skactiveml.visualization.plot_stream_training_data#
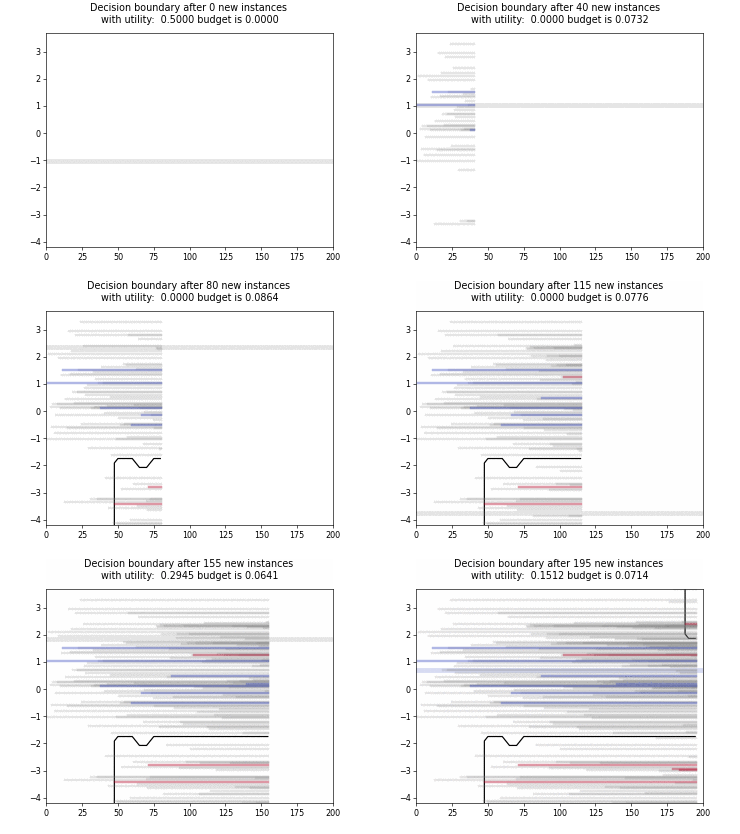
Cognitive Dual-Query Strategy with Random Sampling
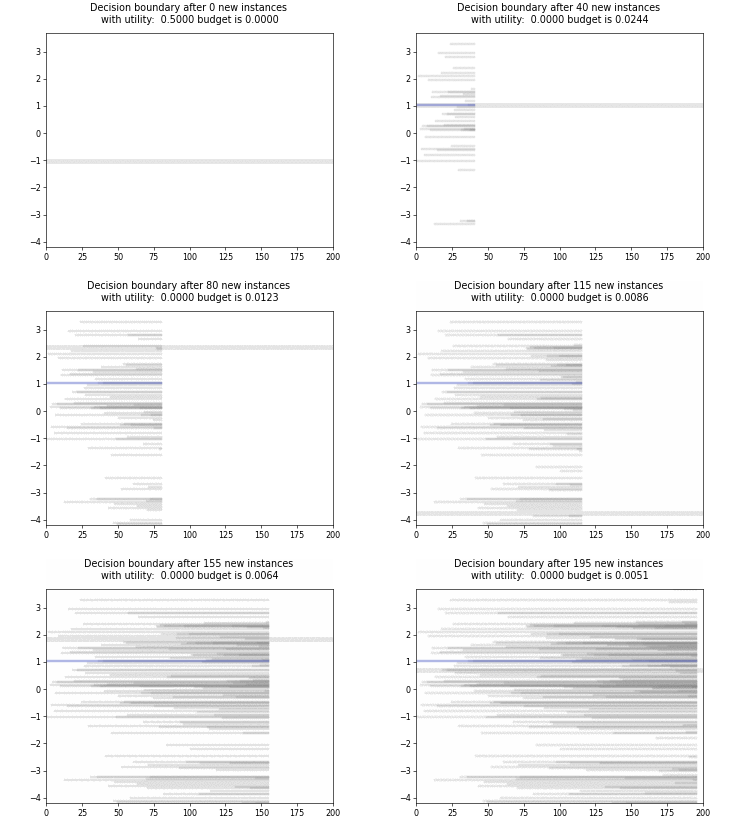
Cognitive Dual-Query Strategy with Fixed-Uncertainty
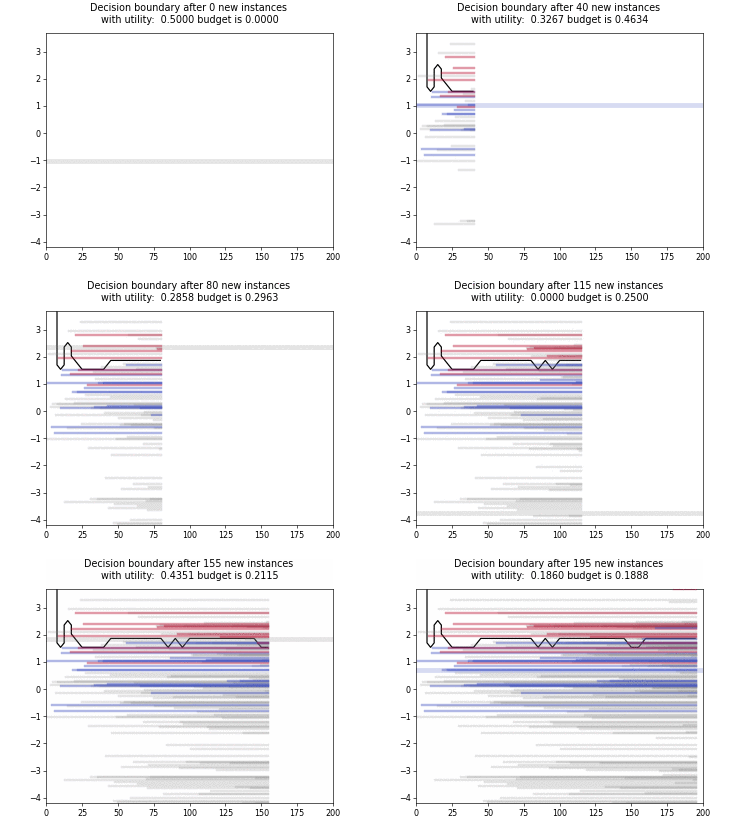
Cognitive Dual-Query Strategy with Variable-Uncertainty
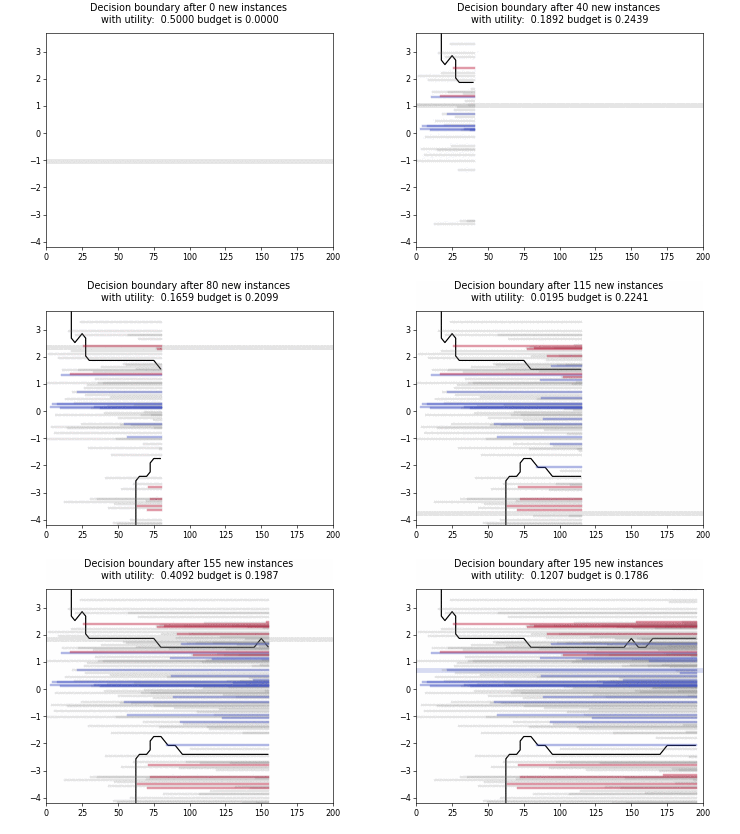
Cognitive Dual-Query Strategy with Randomized-Variable-Uncertainty
