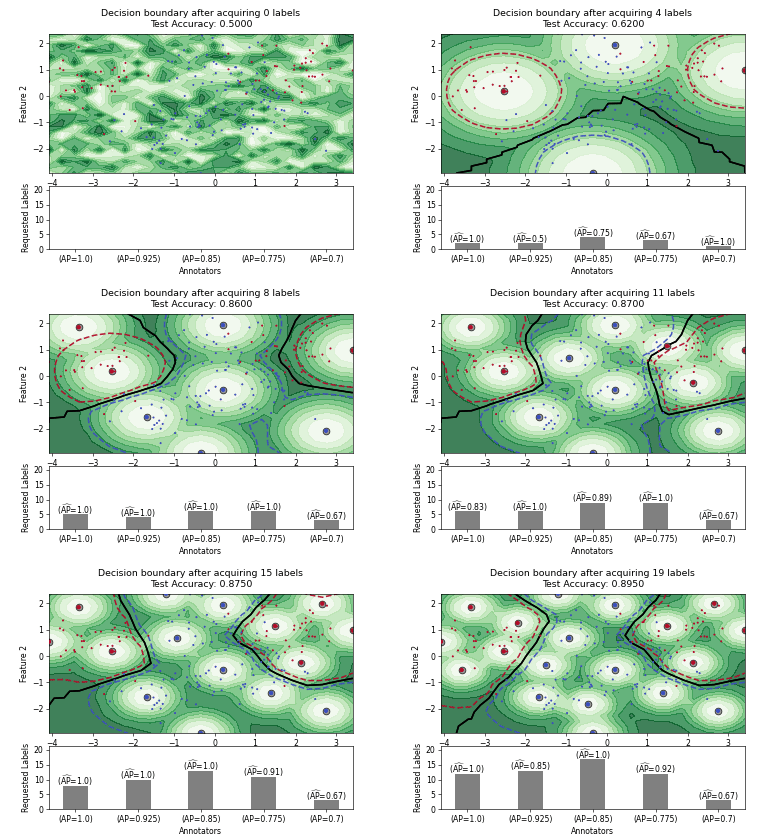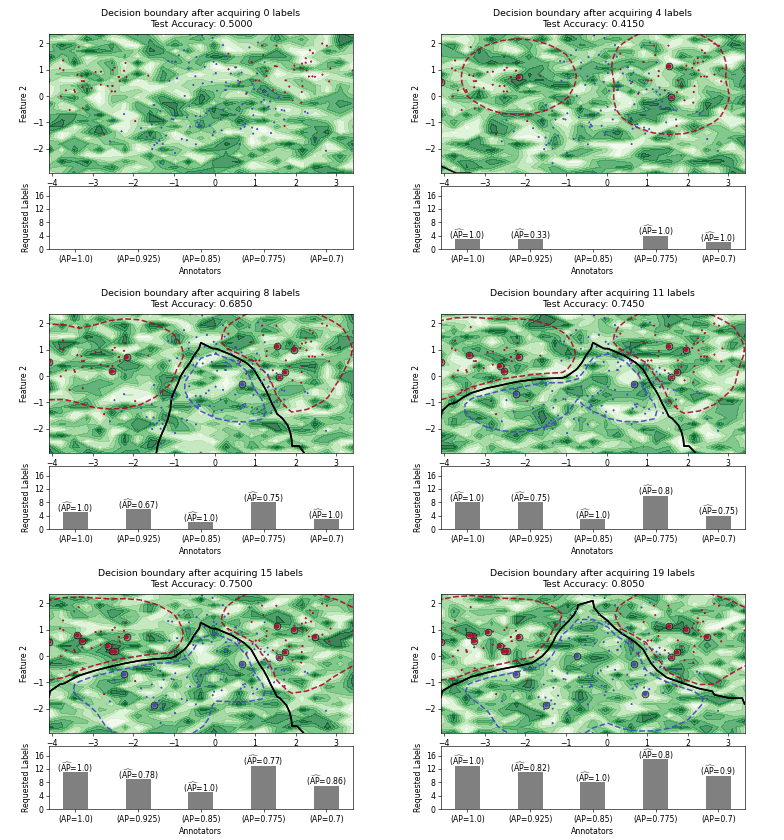
plot_decision_boundary#
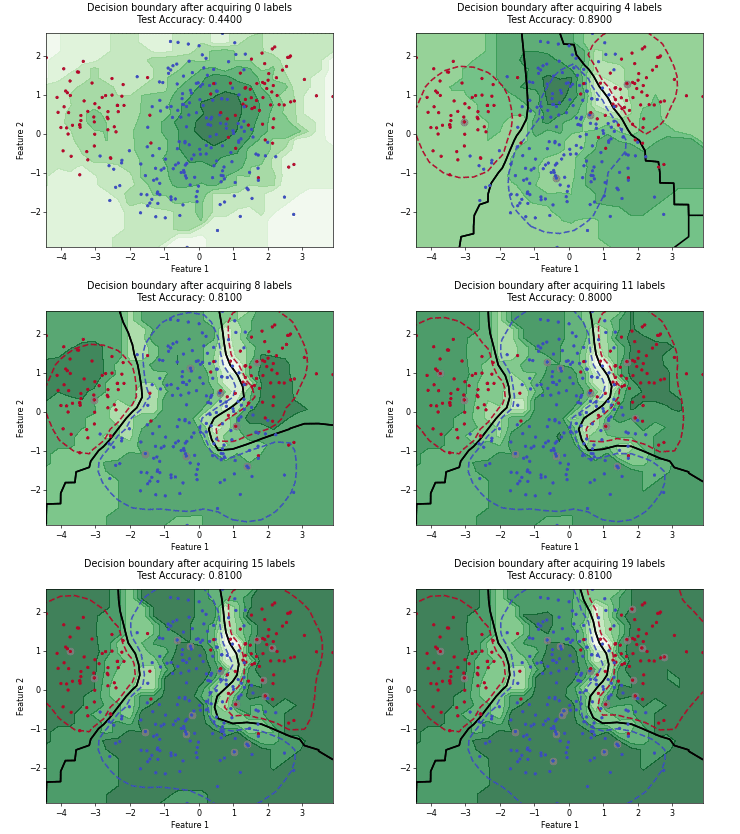
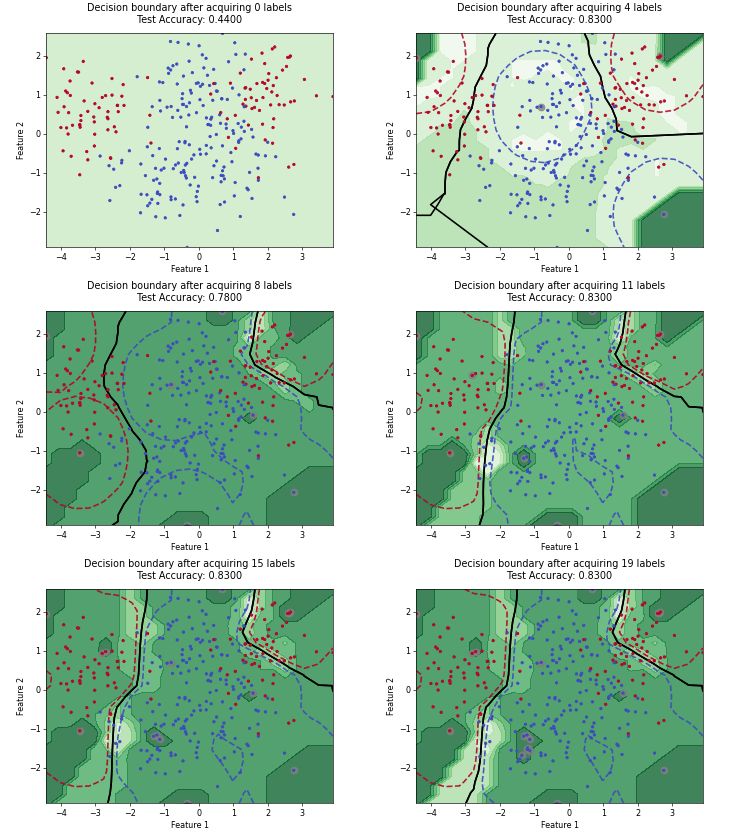
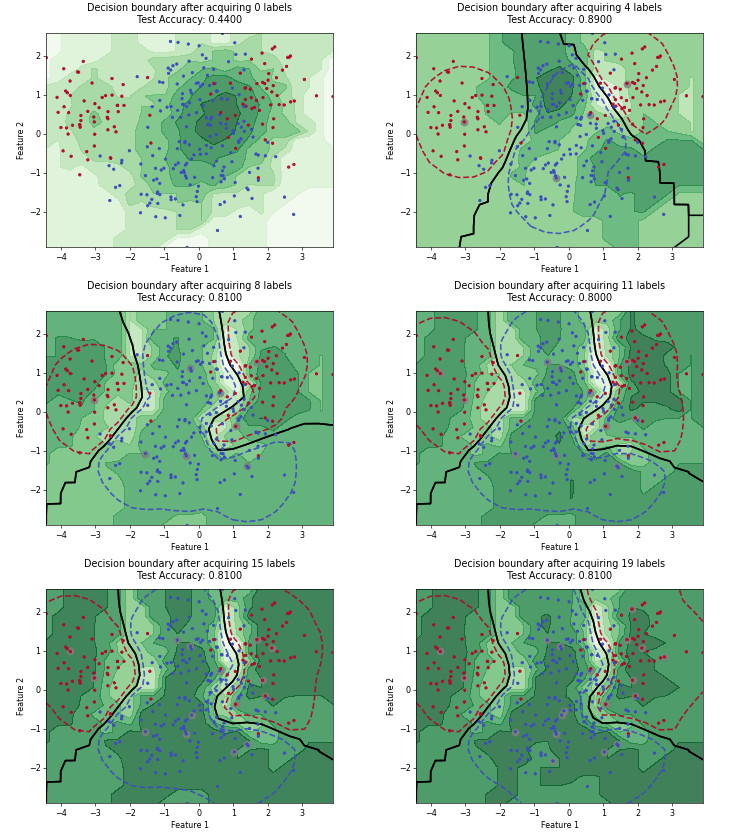
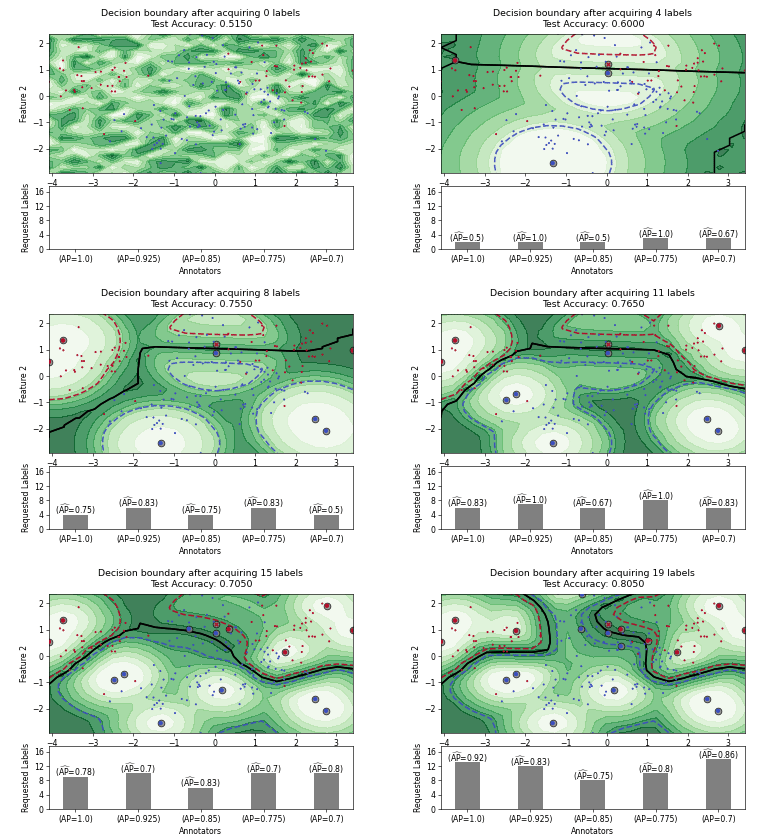
- skactiveml.visualization.plot_decision_boundary(clf, feature_bound, ax=None, res=21, boundary_dict=None, confidence=0.75, cmap='coolwarm', confidence_dict=None)[source]#
Plot the decision boundary of the given classifier.
- Parameters:
- clfsklearn.base.ClassifierMixin
The fitted classifier whose decision boundary is plotted. If confidence is not None, the classifier must implement the predict_proba method. A multi-label classifier must publish its resolved semantics through target_spec_ and implement predict_proba.
- feature_boundarray-like of shape [[xmin, ymin], [xmax, ymax]]
Determines the area in which the boundary is plotted.
- axmatplotlib.axes.Axes or array-like of matplotlib.axes.Axes, default=None
The axis on which the decision boundary is plotted. For multi-label classification, one axis overlays all label-output boundaries, while an array-like must contain one axis per label output and plots output j on axis j.
- resint, default=21
The resolution of the plot.
- boundary_dictdict, default=None
Additional parameters for the boundary contour.
- confidencescalar or None, default=0.75
The confidence interval plotted with dashed lines. It is not plotted if confidence is None. Must be in the open interval (0.5, 1). The value stands for the ratio best class / second best class. For each binary label output of a multi-label classifier, the dashed contours are drawn at positive-class probabilities 1 - confidence and confidence.
- cmapstr or matplotlib.colors.Colormap, default=’coolwarm’
The colormap for the confidence levels and, unless overridden through boundary_dict, the multi-label output boundaries. On separate multi-label output axes, the lower and upper confidence contours use the colormap’s endpoints. On one overlaid axis, each output’s confidence contours use that output’s colormap position.
- confidence_dictdict, default=None
Additional parameters for the confidence contour. Must not contain a colormap because cmap is used.
- Returns:
- axmatplotlib.axes.Axes or array-like of matplotlib.axes.Axes
The supplied axis or axes on which the boundaries were plotted. A multi-label boundary is the 0.5 contour of each label output’s positive-class probability, whose positive class is clf.target_spec_.classes[j][1].
Examples using skactiveml.visualization.plot_decision_boundary#
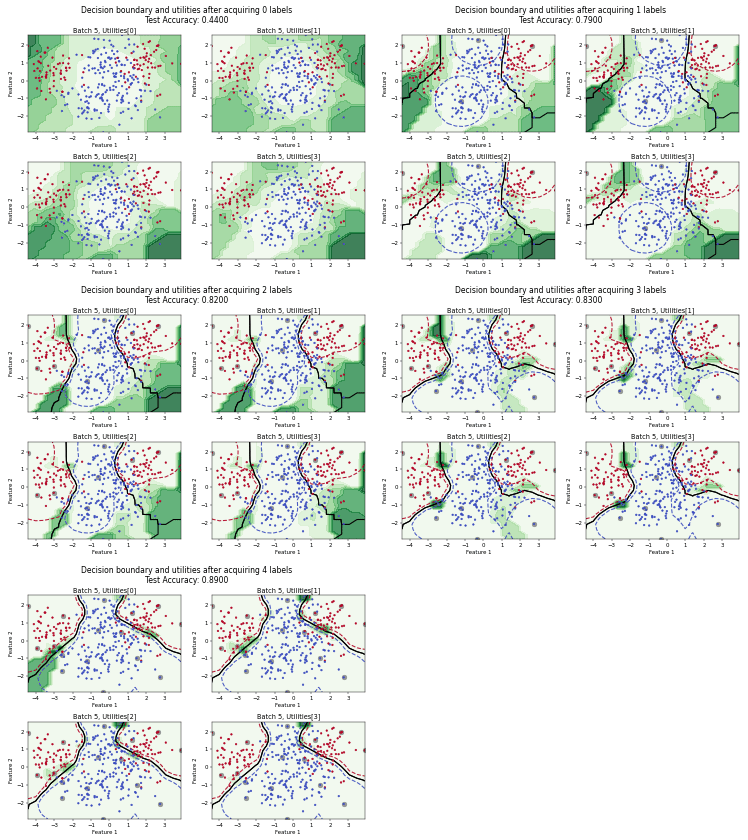
Batch Active Learning by Diverse Gradient Embedding (BADGE)
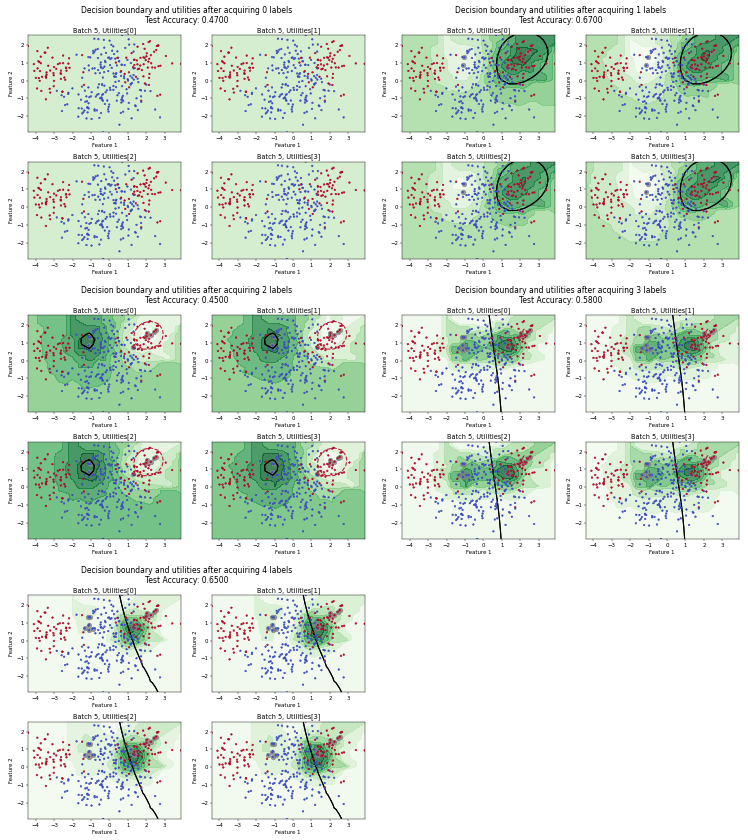
Batch Bayesian Active Learning by Disagreement (BatchBALD)
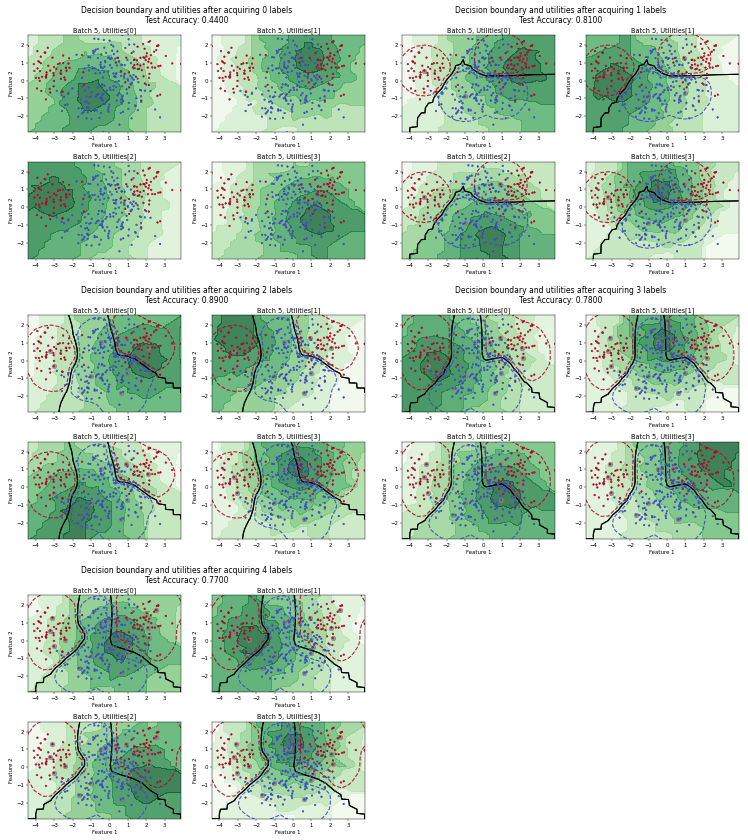
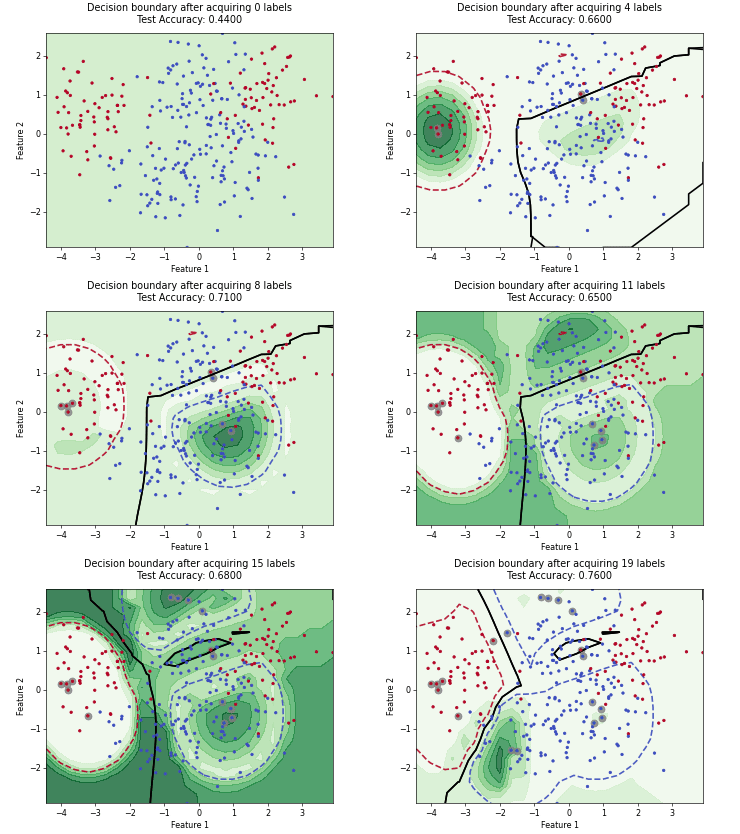
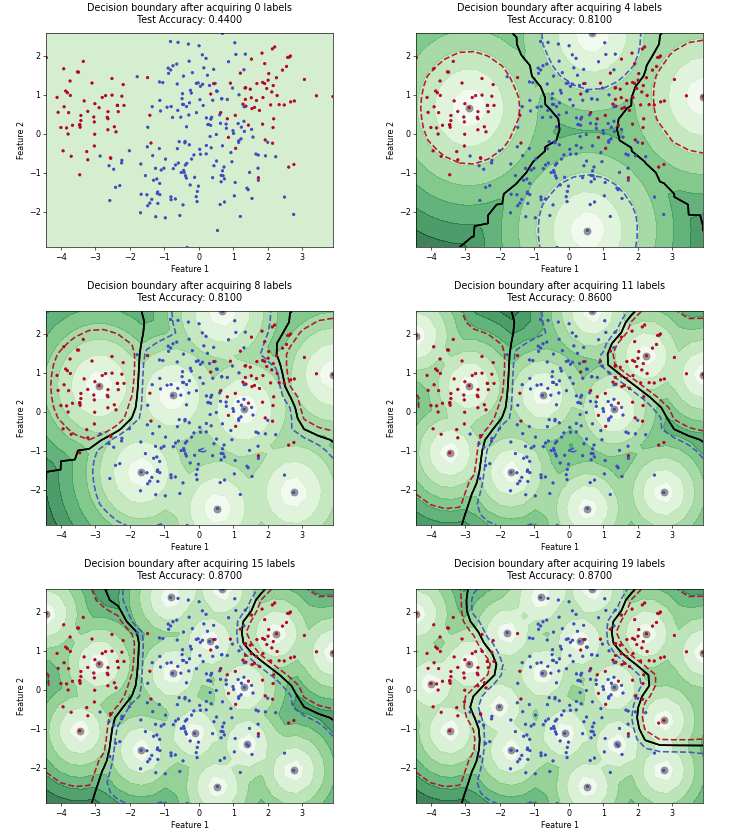
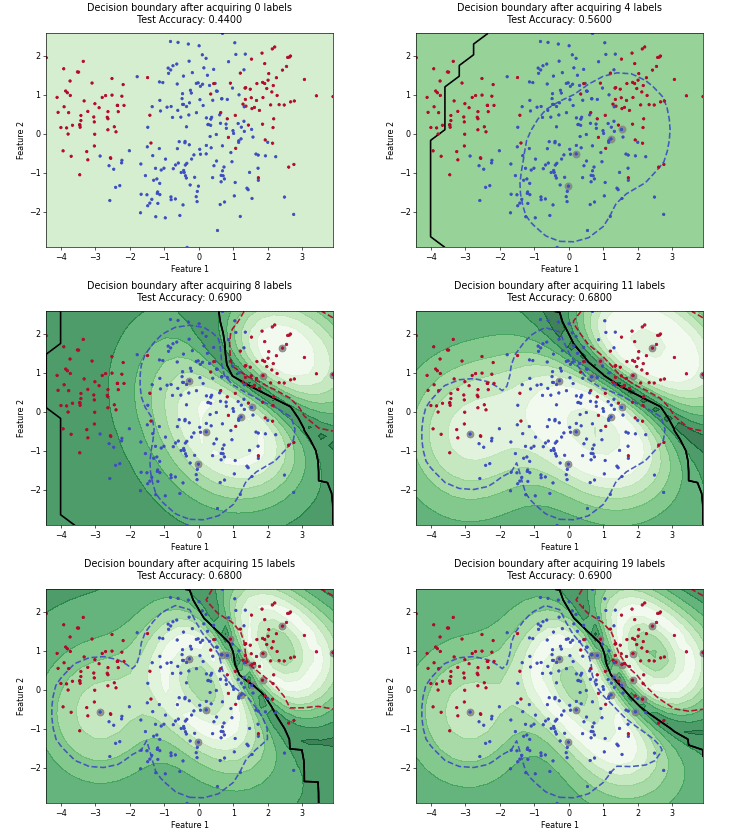
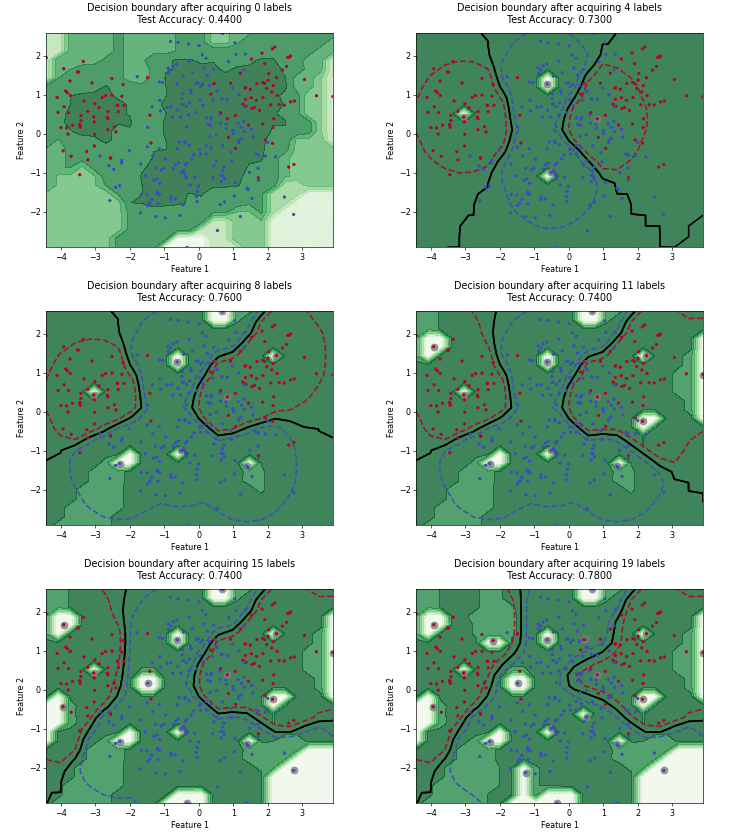
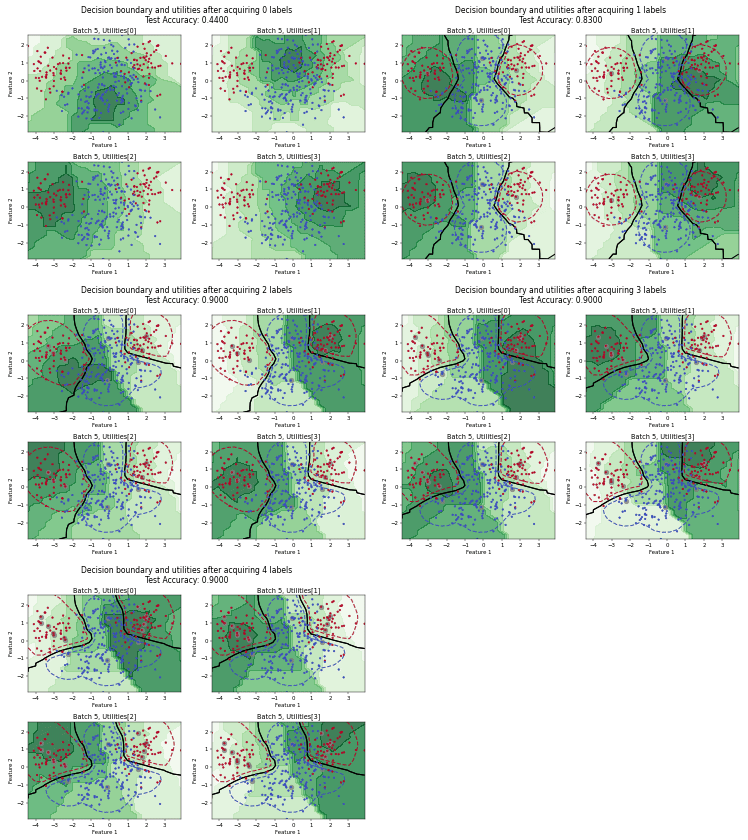
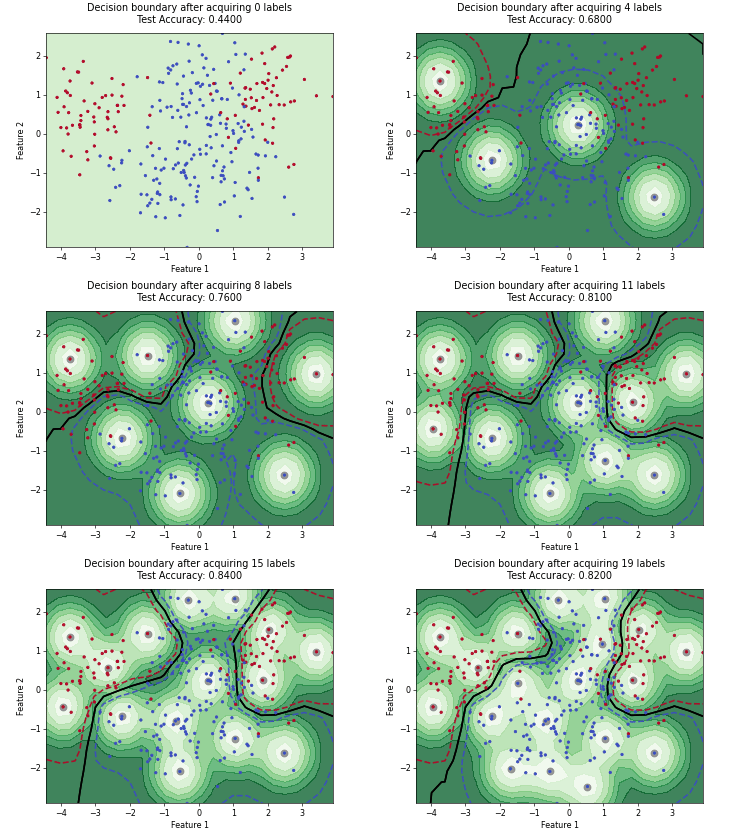
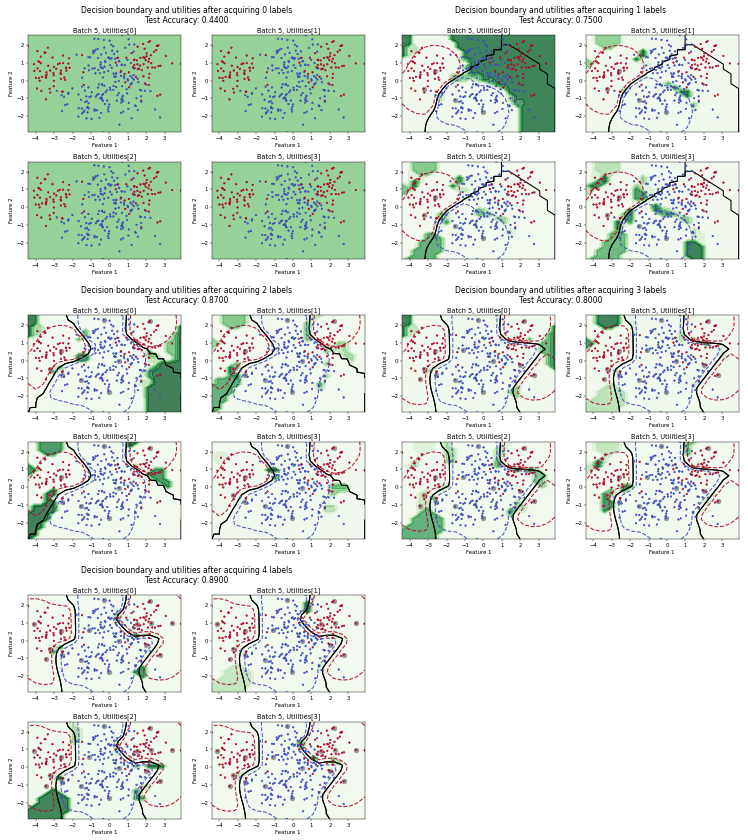
Fast Active Learning by Contrastive UNcertainty (FALCUN)
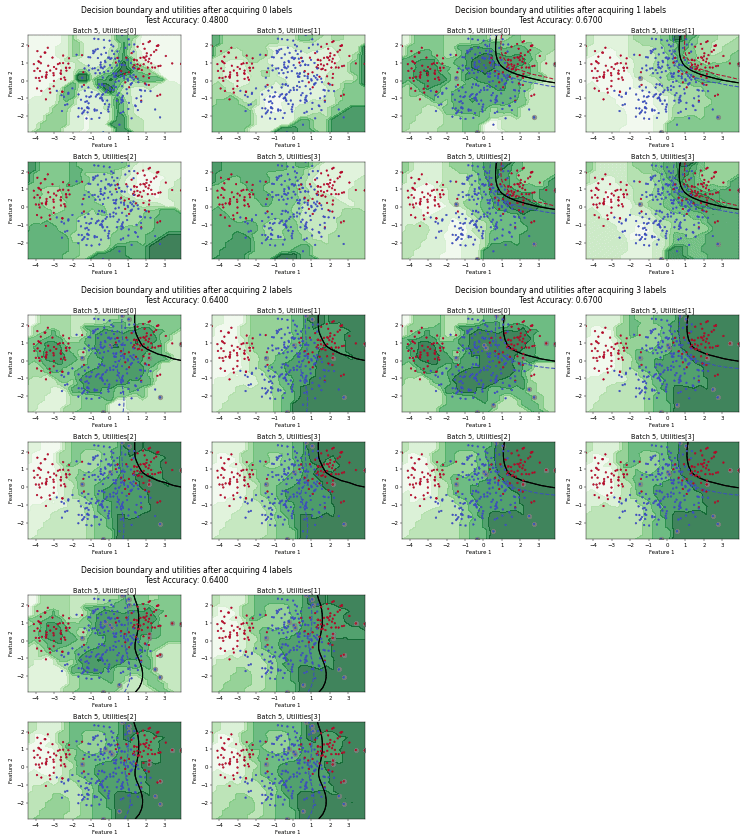
Batch Density-Diversity-Distribution-Distance Sampling (4DS)
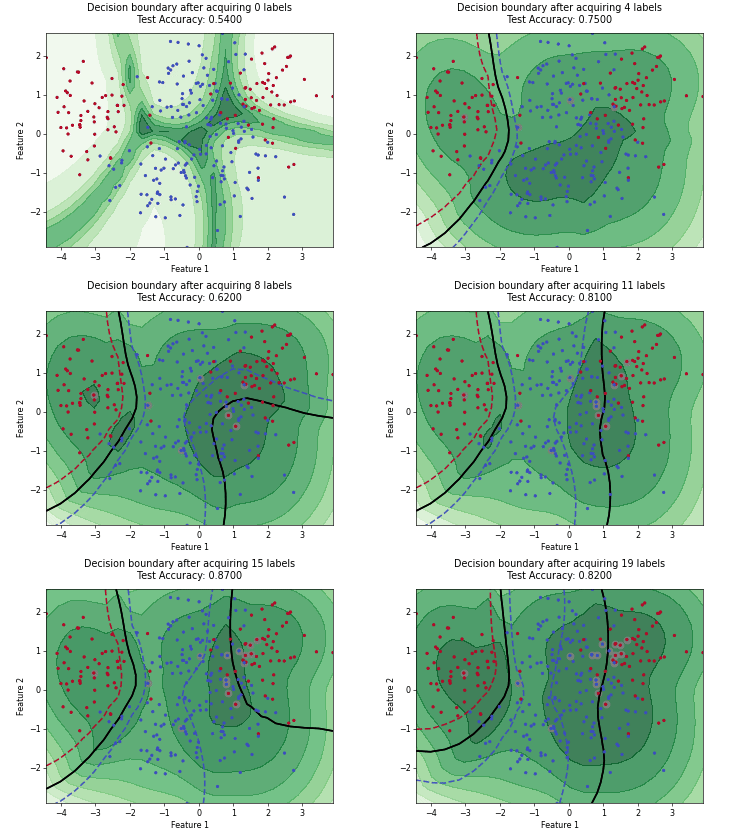
Density-Diversity-Distribution-Distance Sampling (4DS)
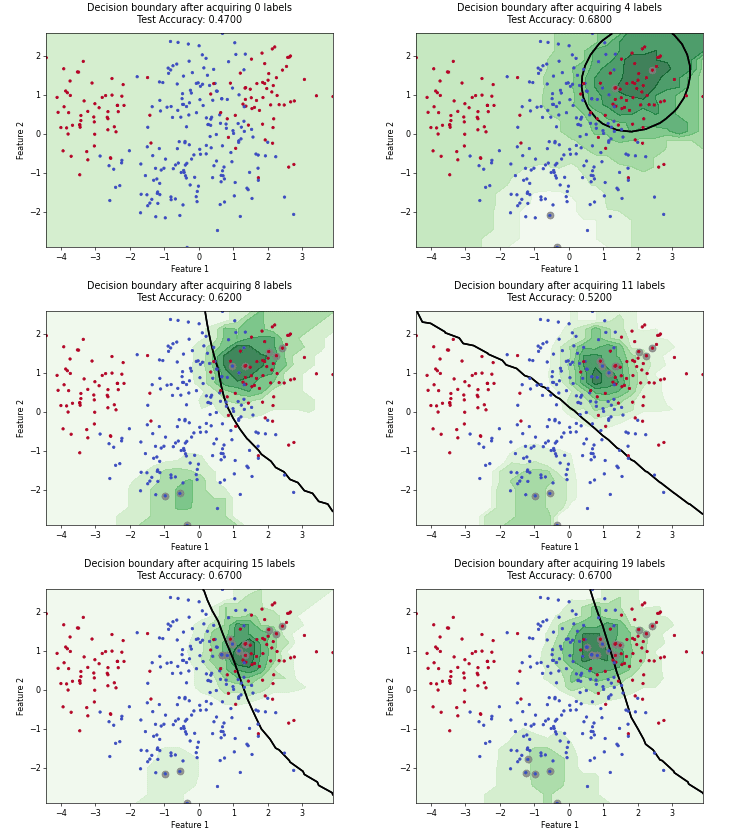
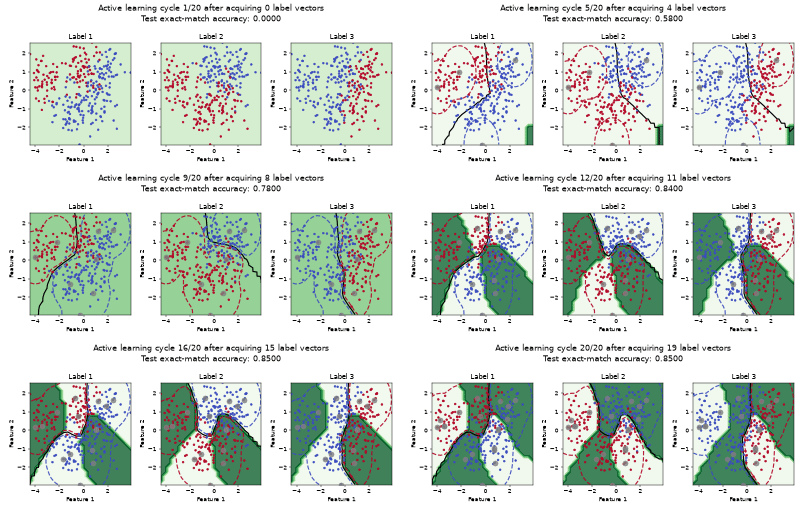
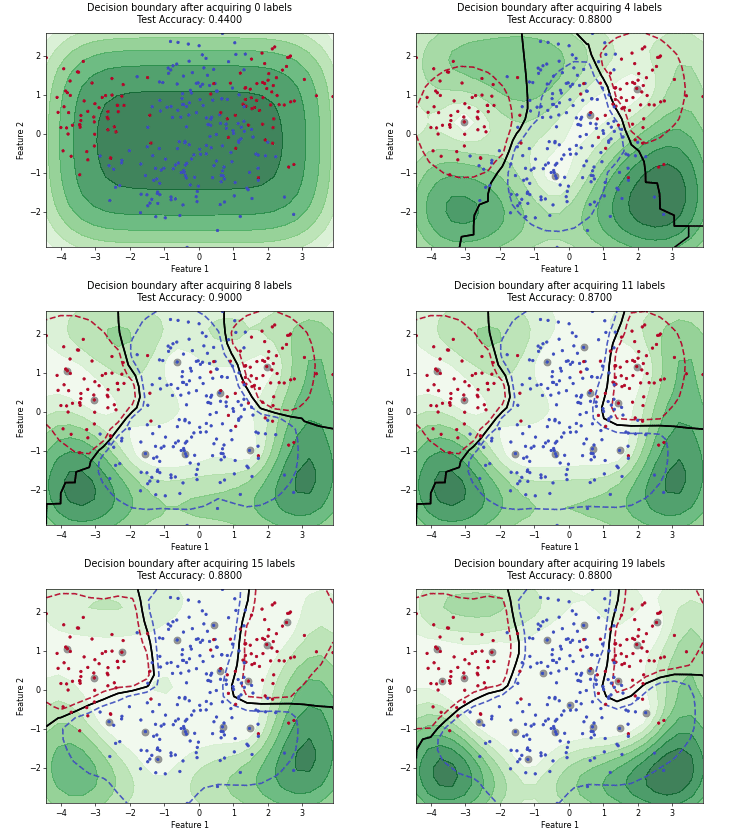
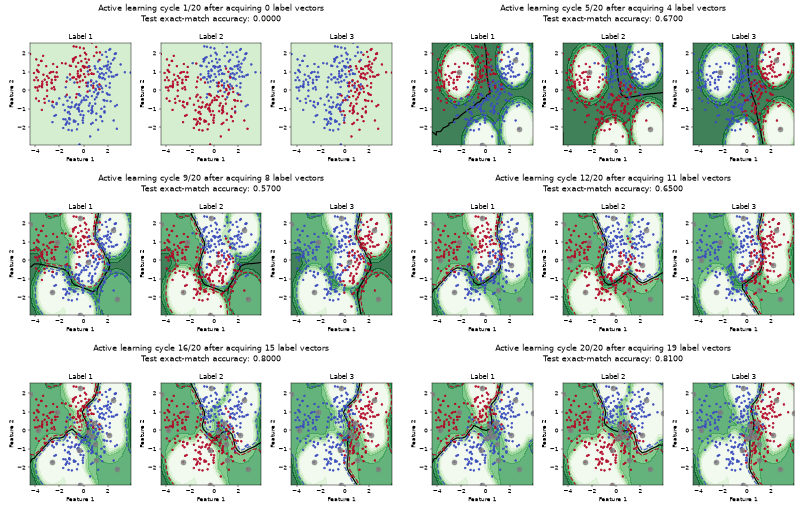
Maximum Loss Reduction with Maximal Confidence (MMC)
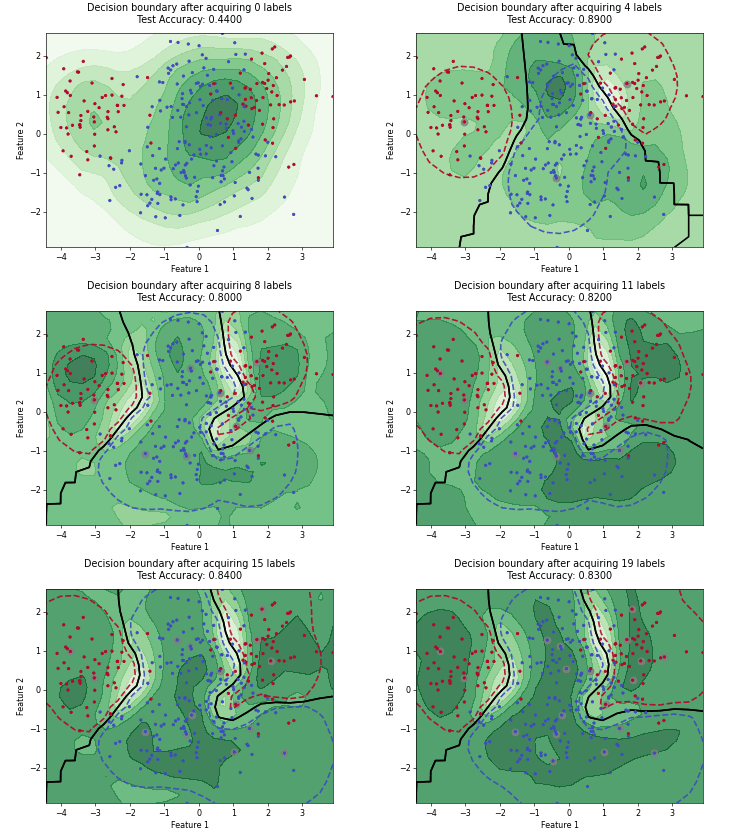
Monte-Carlo Expected Error Reduction (EER) with Log-Loss
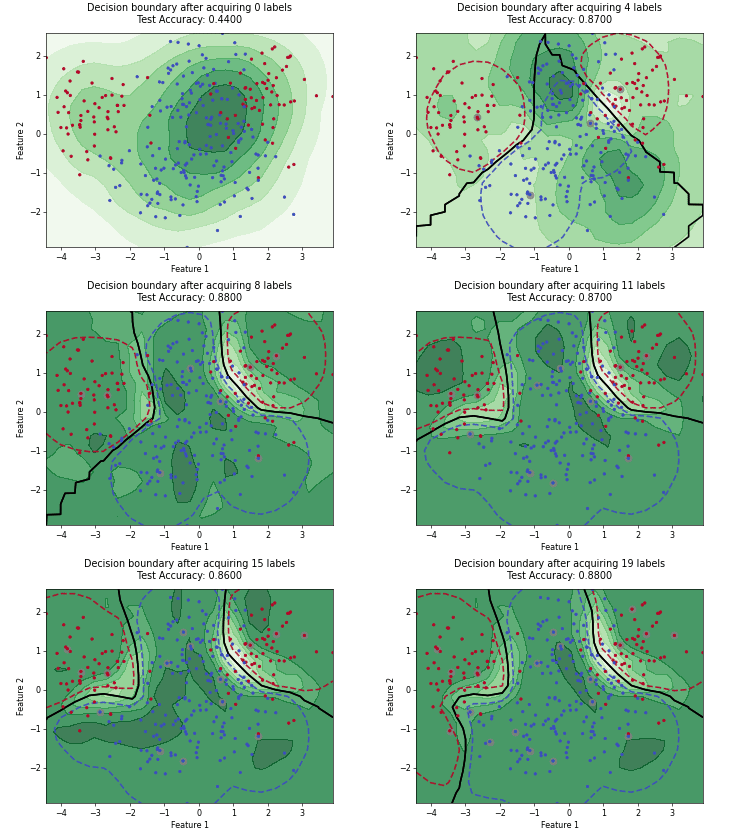
Monte-Carlo Expected Error Reduction (EER) with Misclassification-Loss
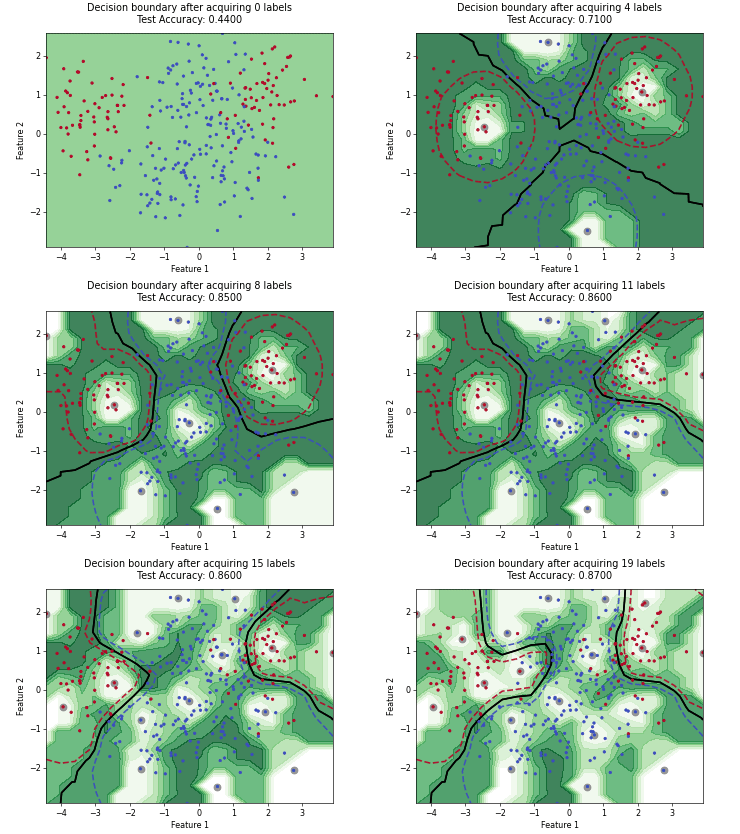
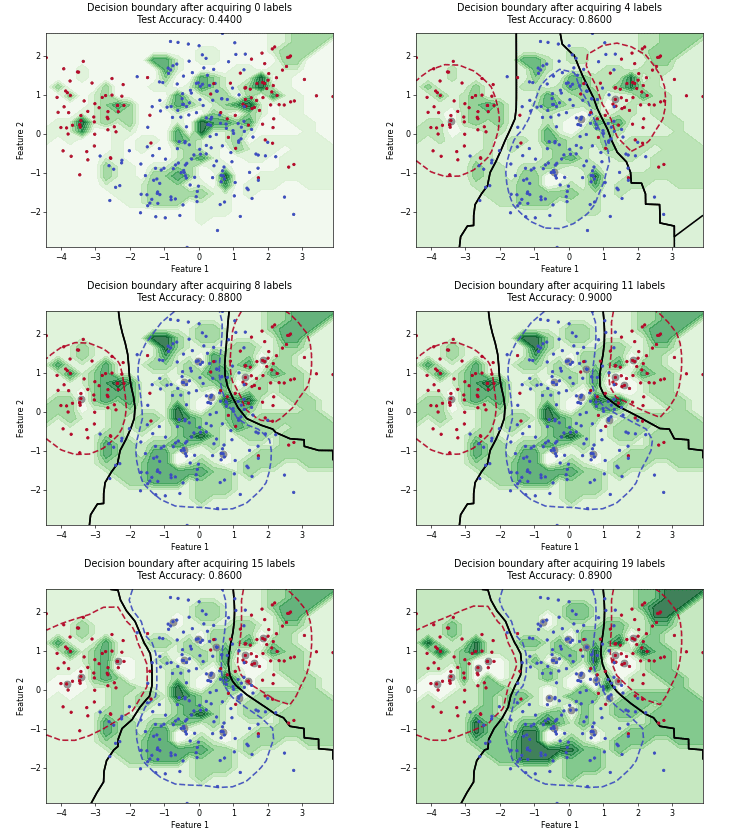
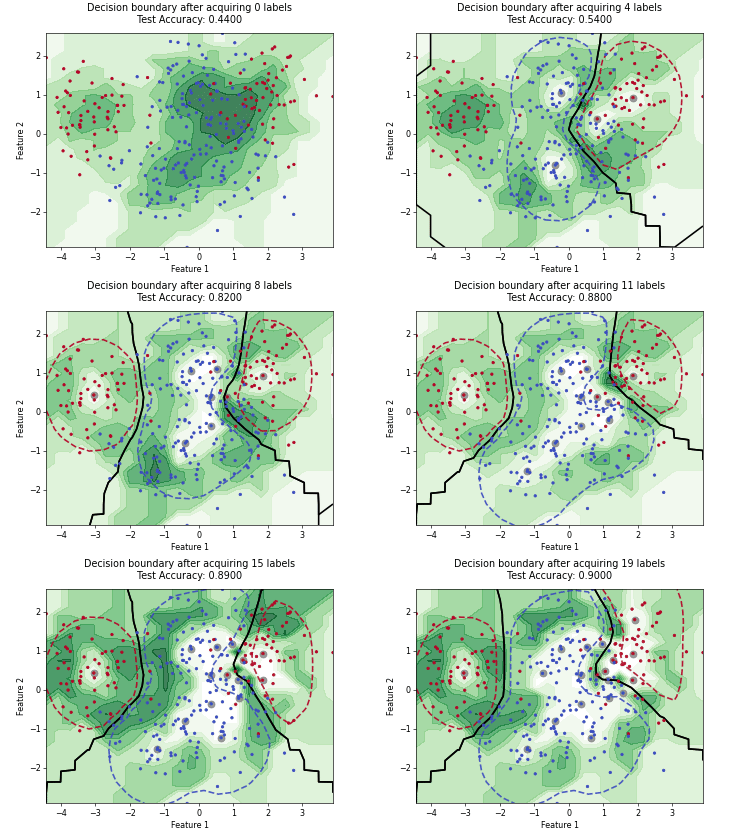
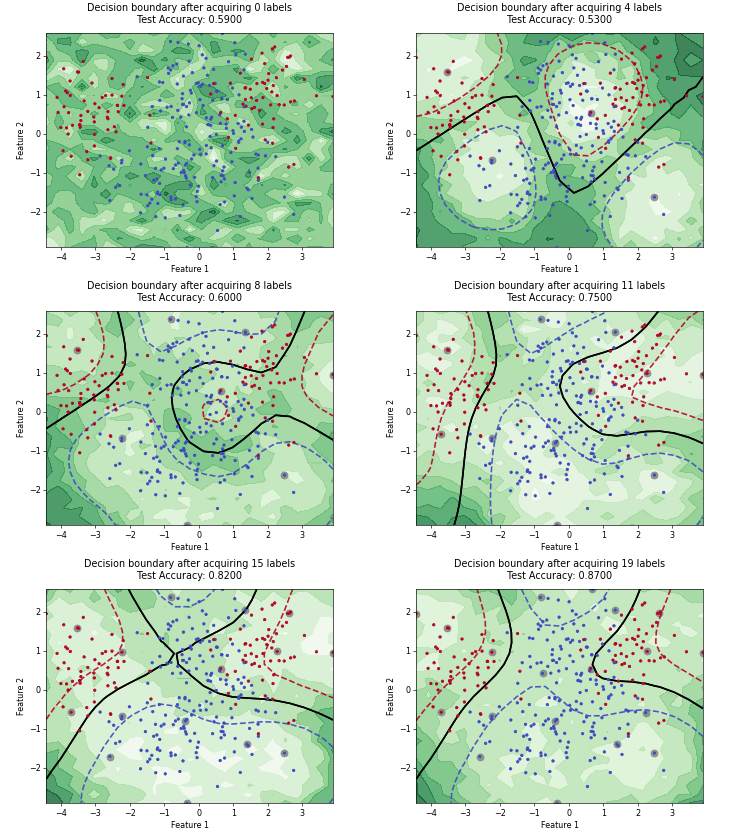
Query-by-Committee (QBC) with Kullback-Leibler Divergence
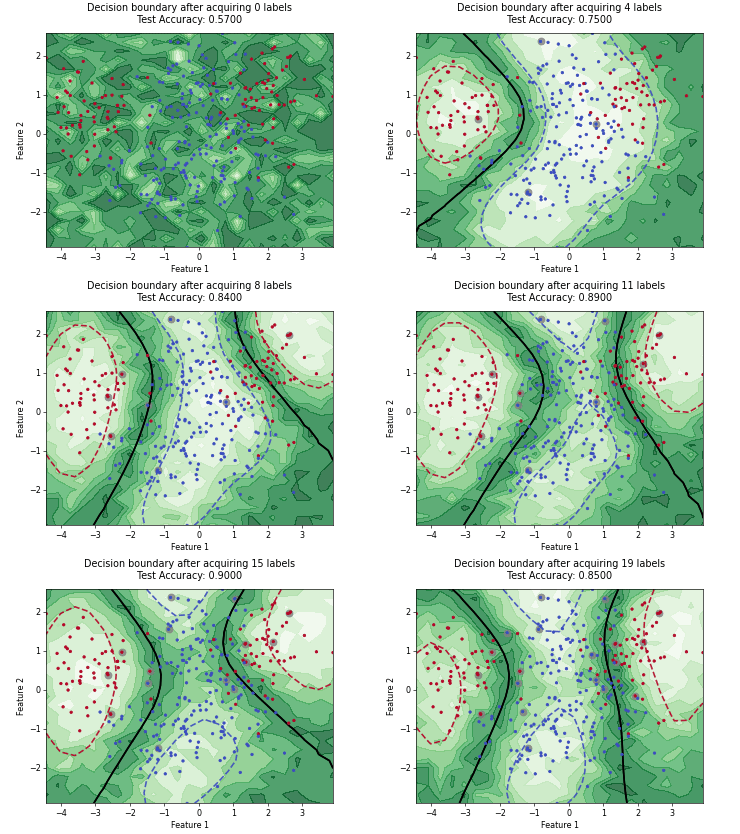
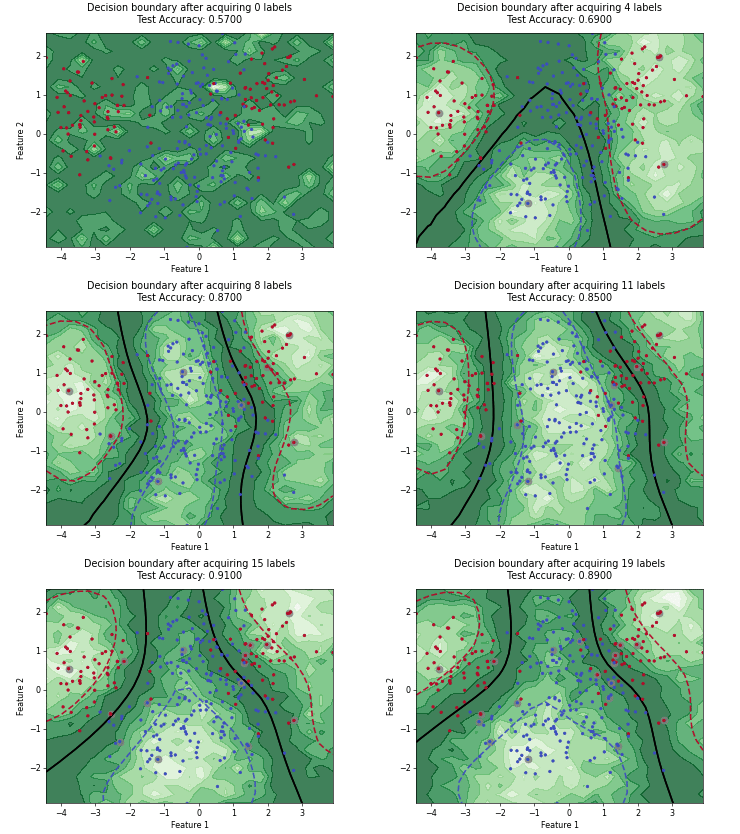
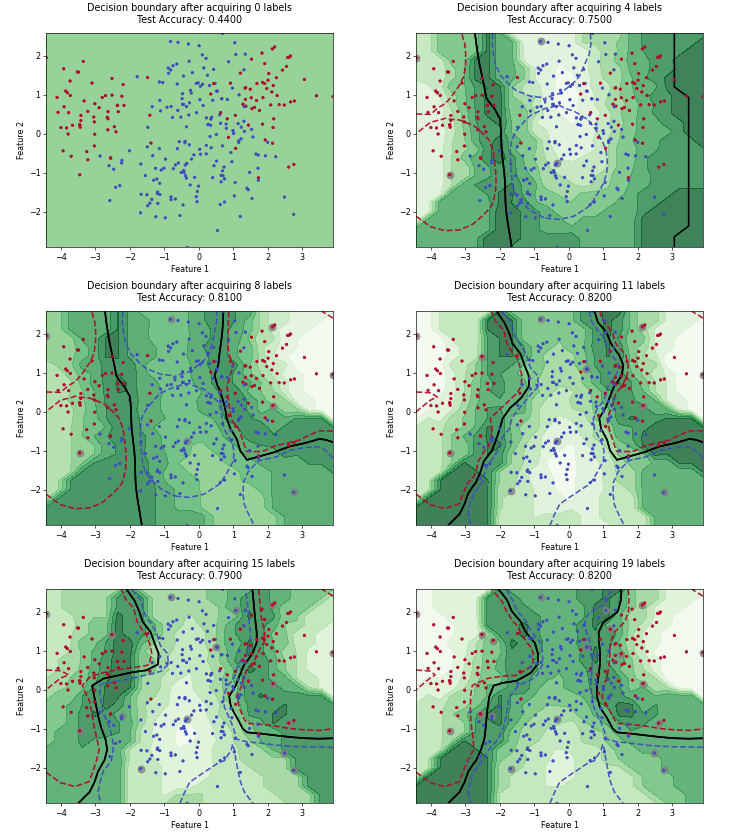
Querying Informative and Representative Examples (QUIRE)
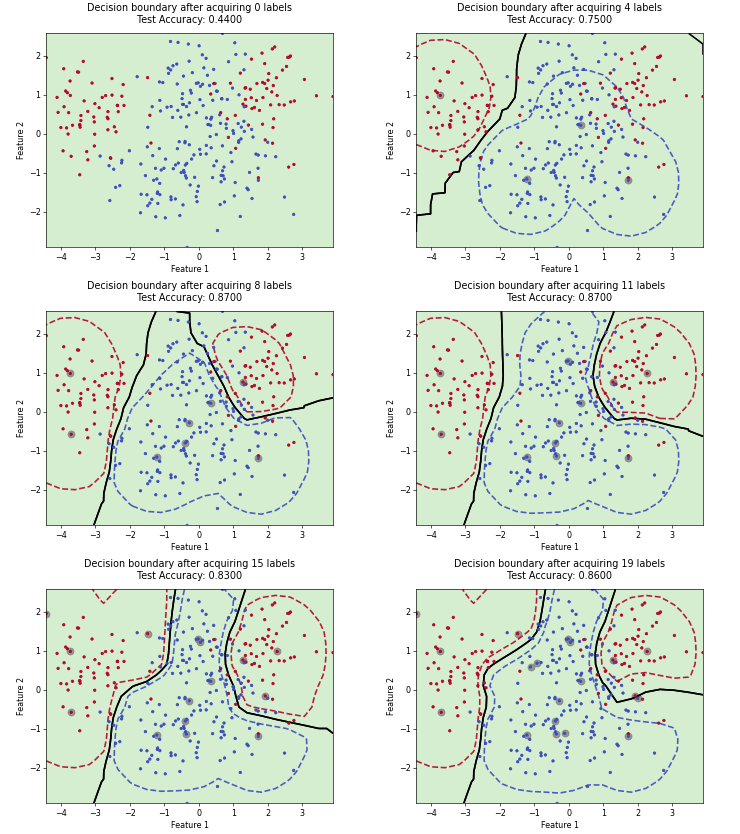
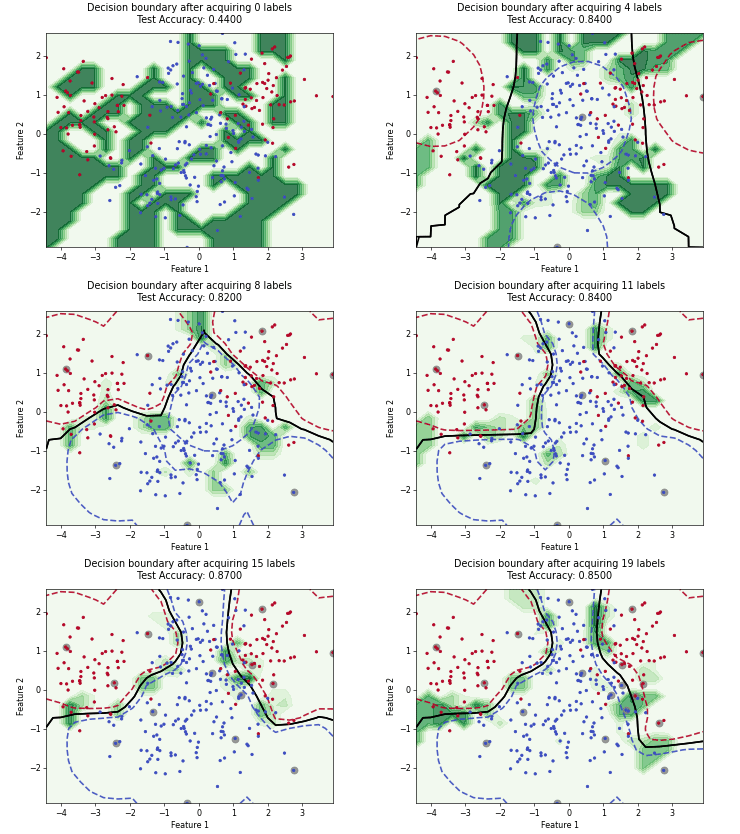
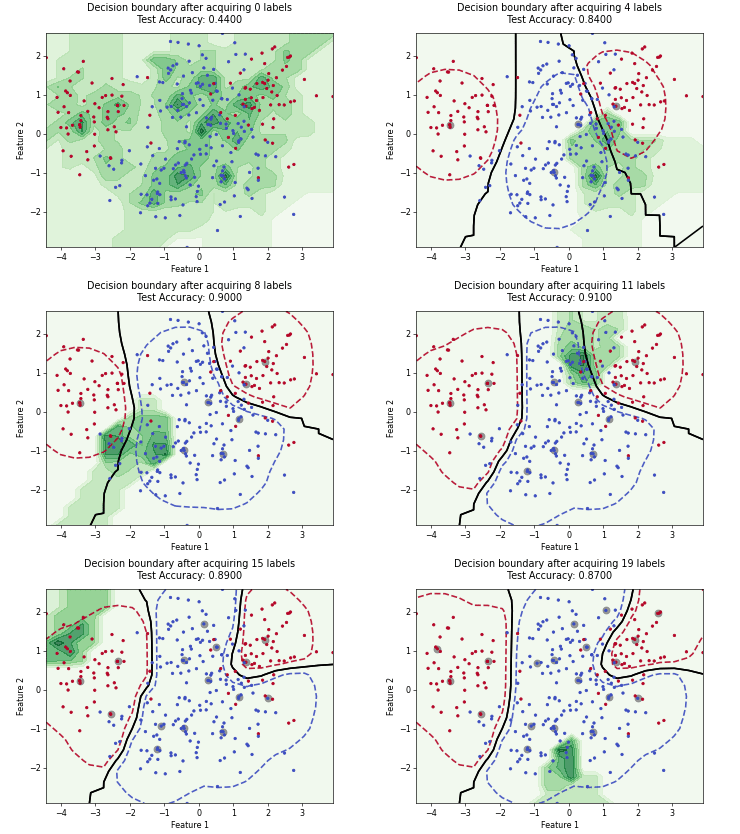
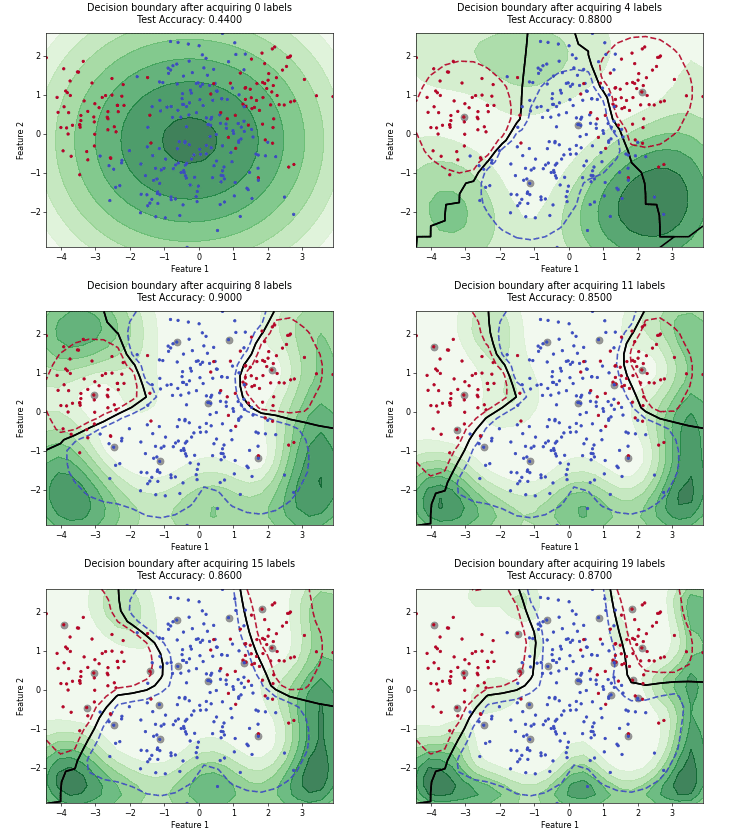
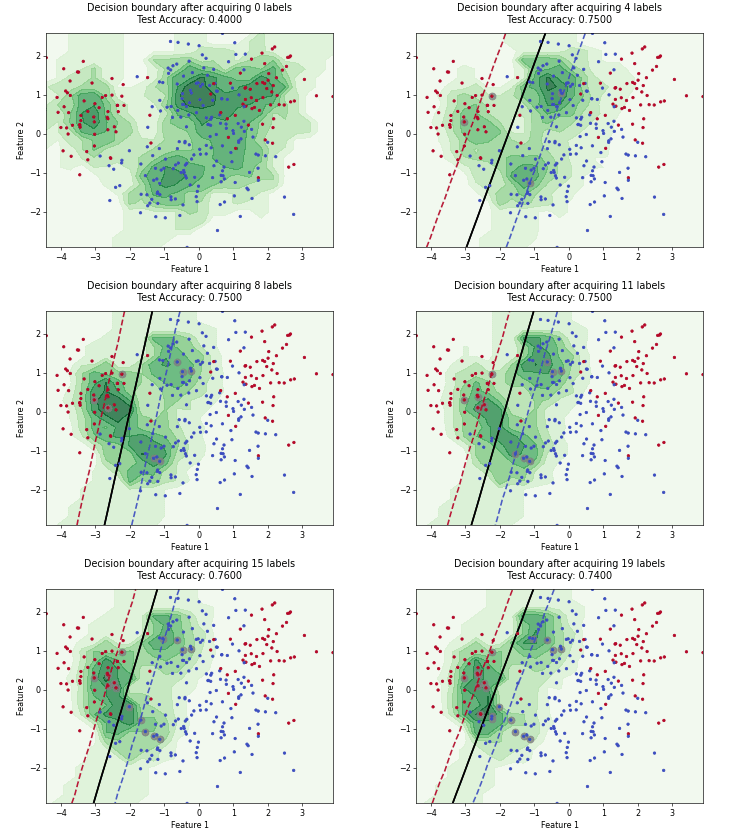
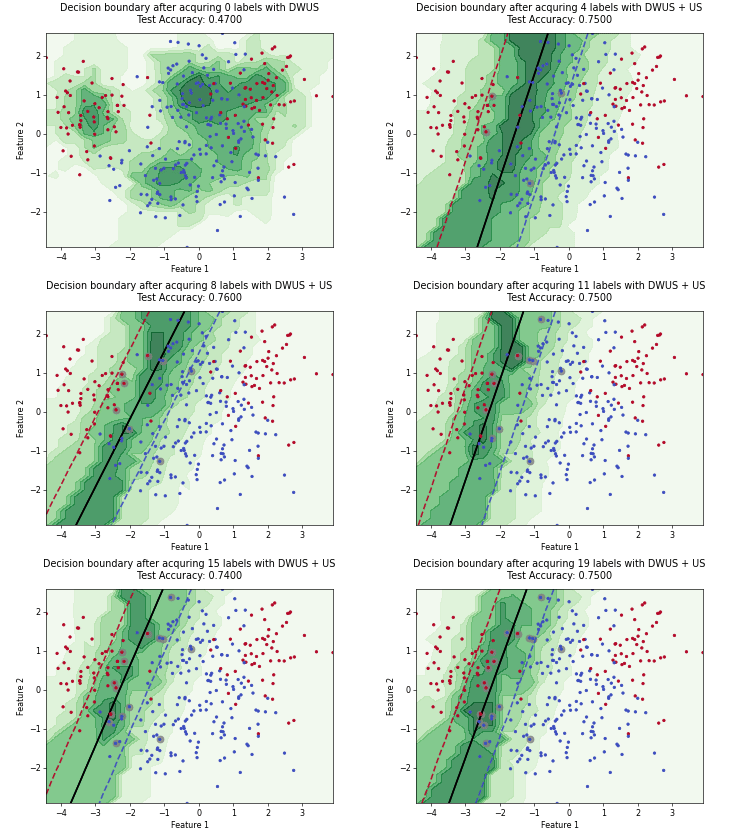
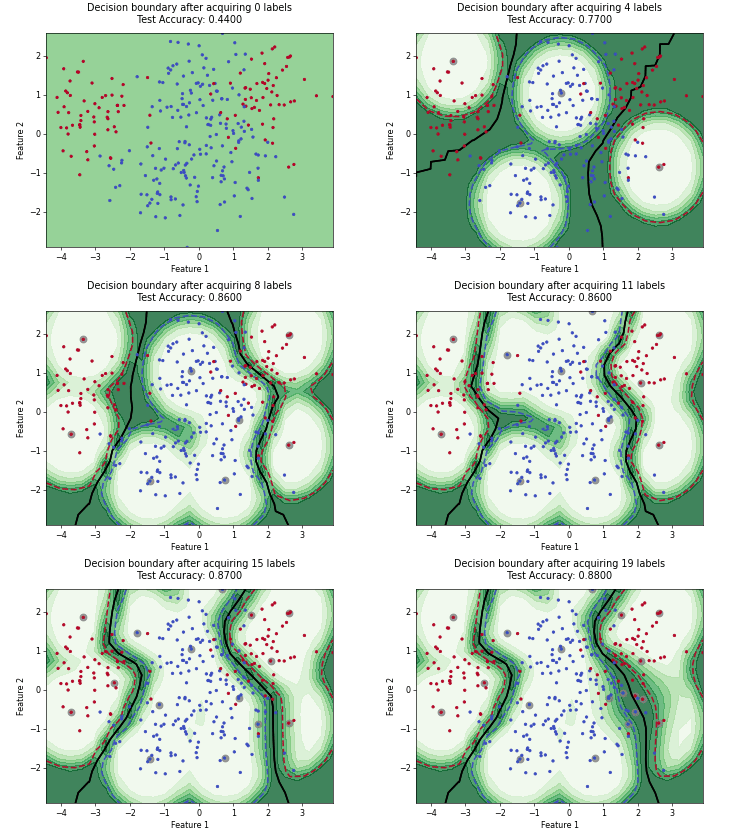
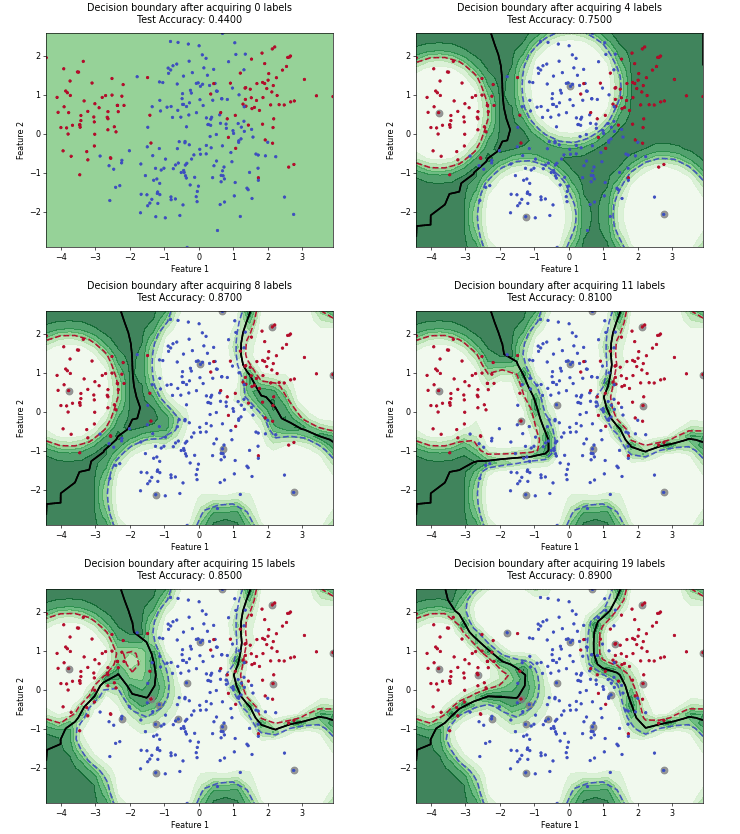
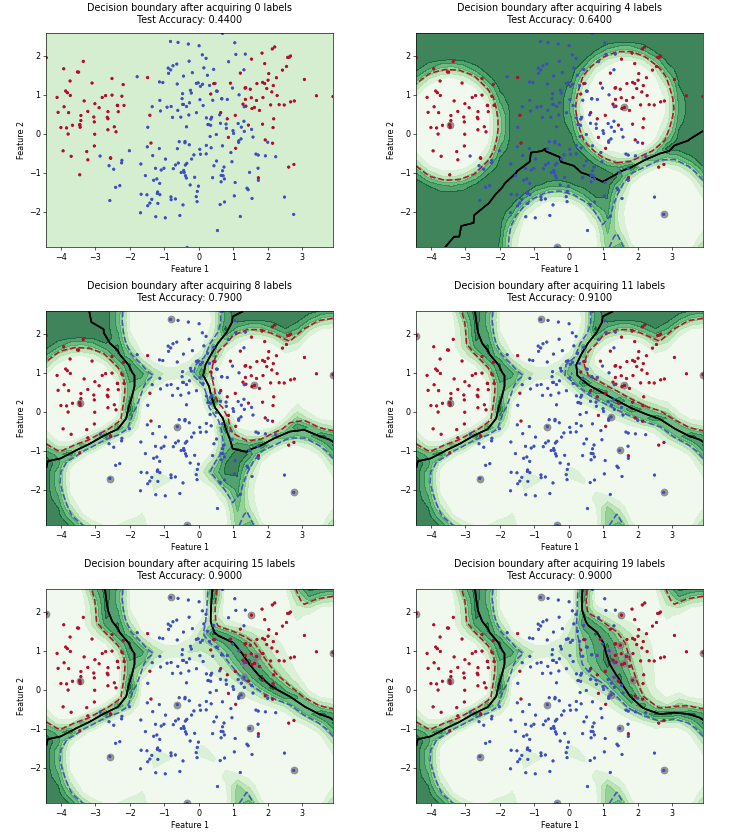
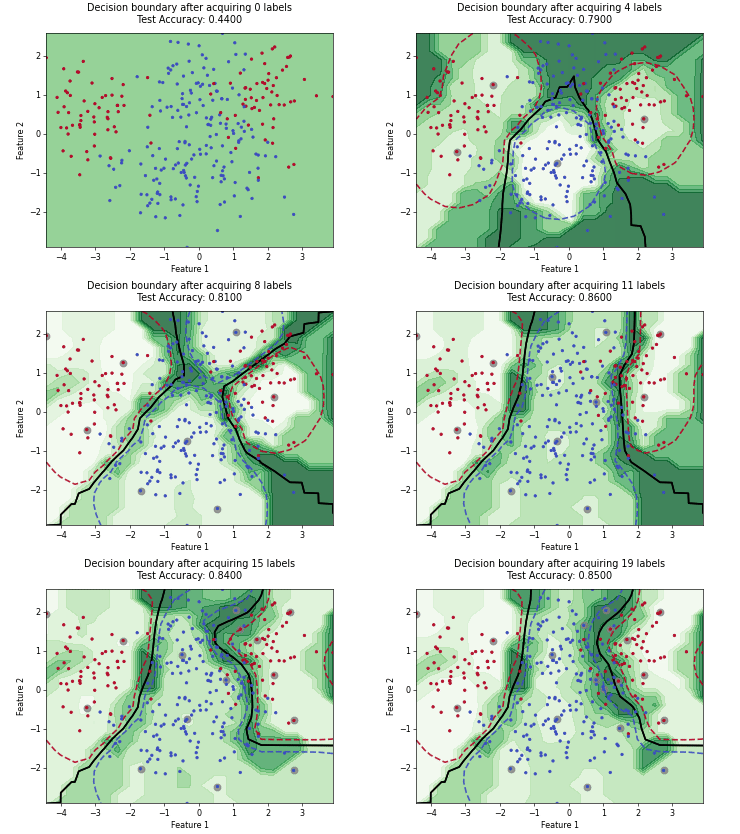
Uncertainty Sampling with Expected Average Precision (USAP)