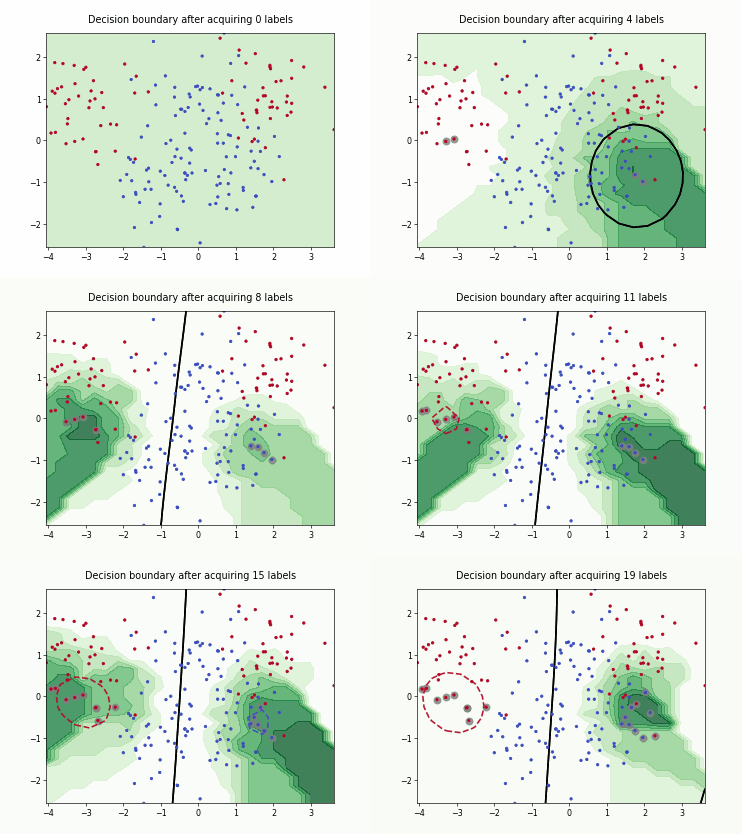
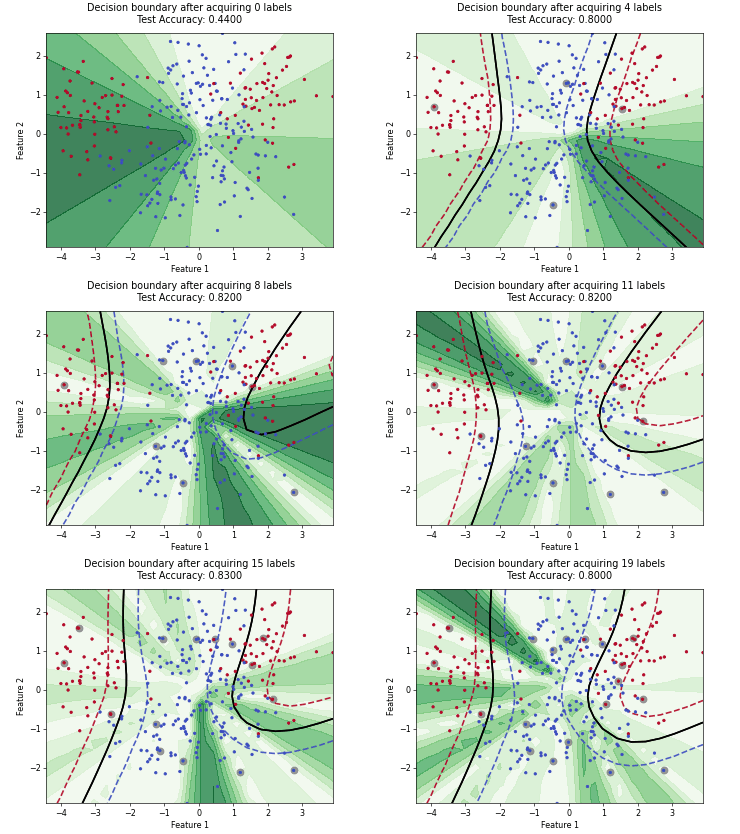
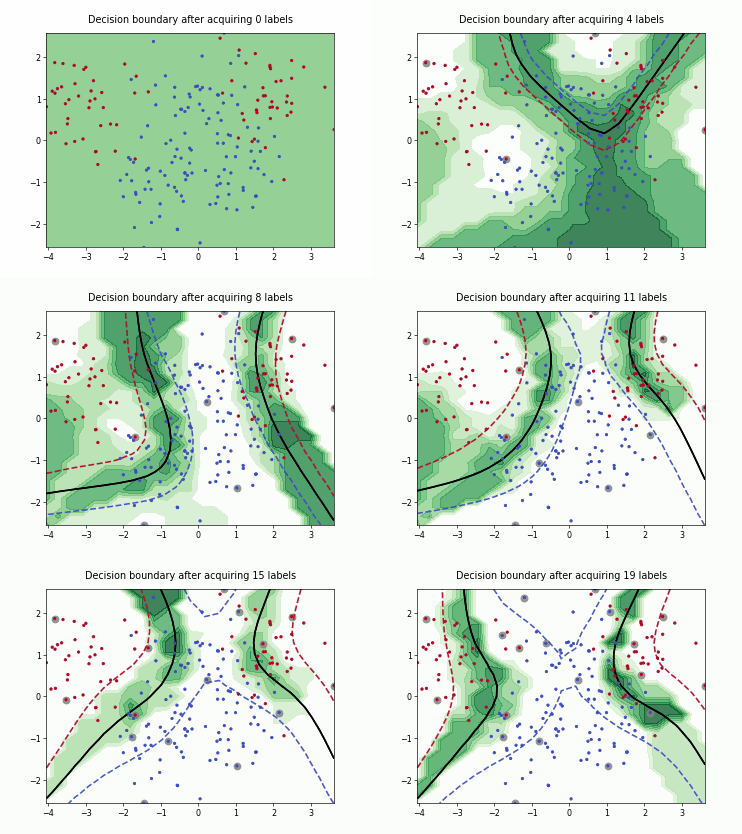
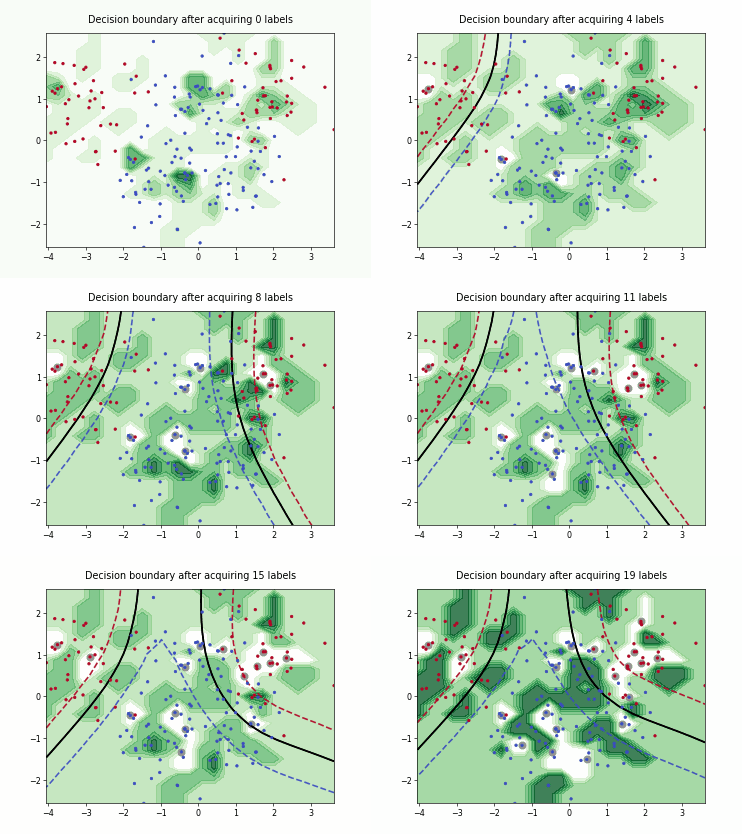
plot_decision_boundary#
- skactiveml.visualization.plot_decision_boundary(clf, feature_bound, ax=None, res=21, boundary_dict=None, confidence=0.75, cmap='coolwarm', confidence_dict=None)[source]#
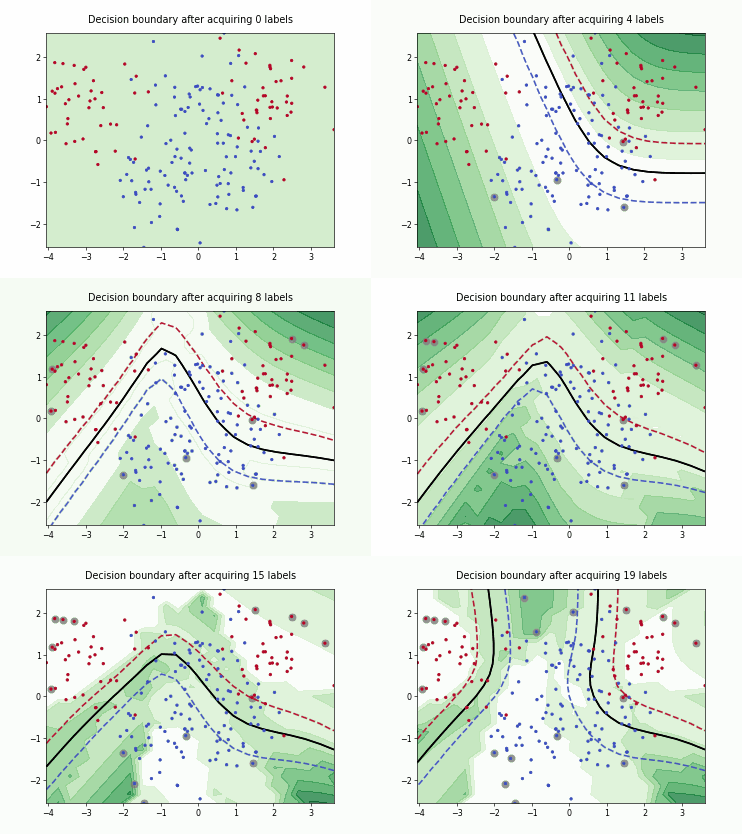
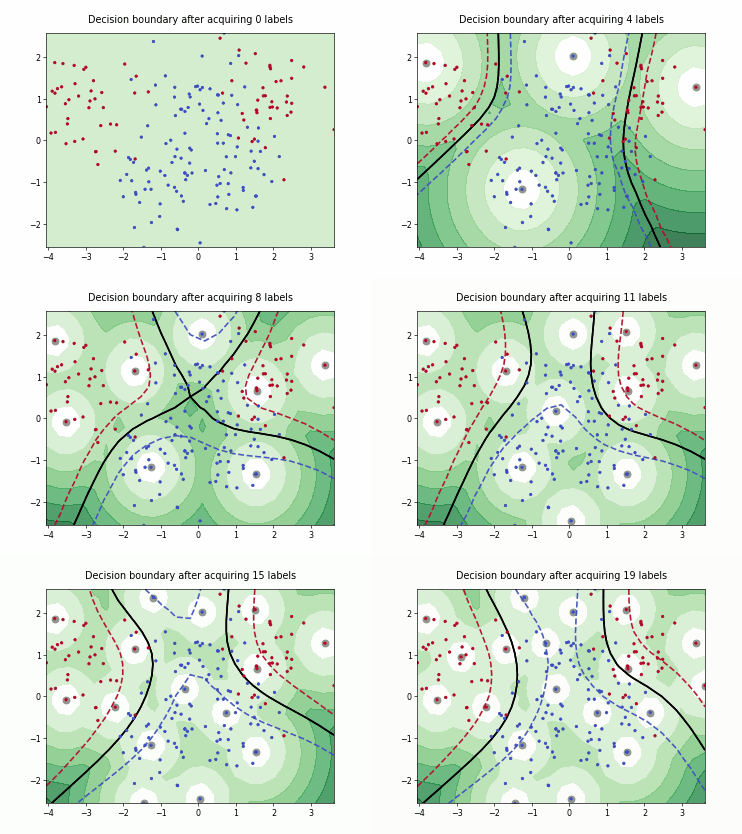
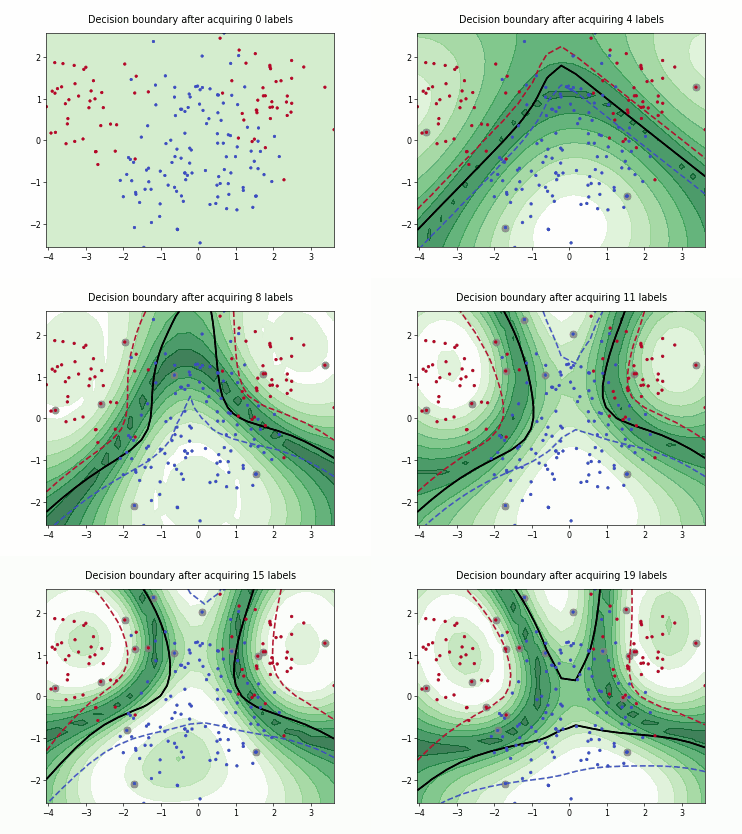
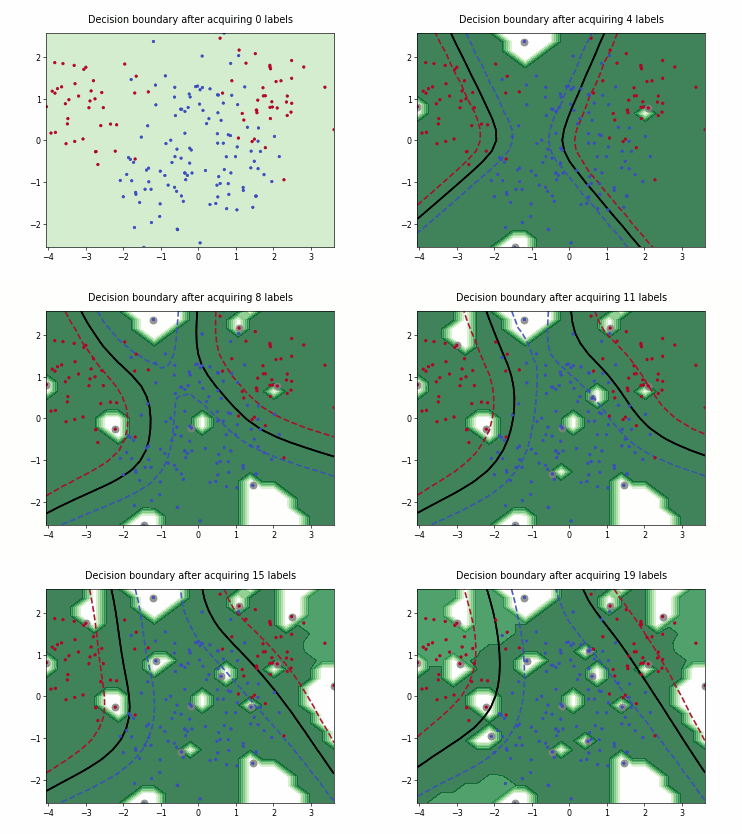
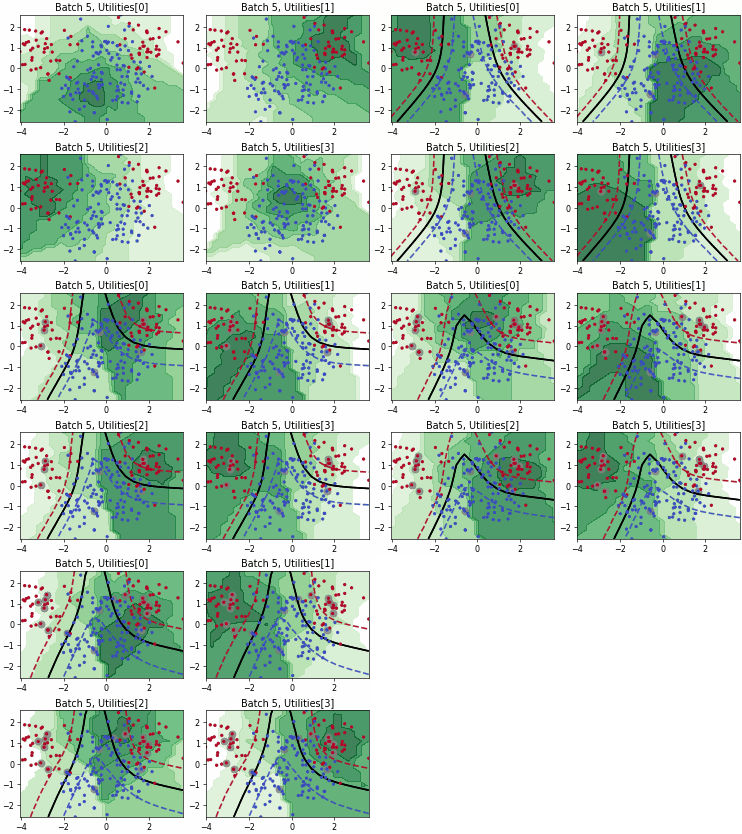
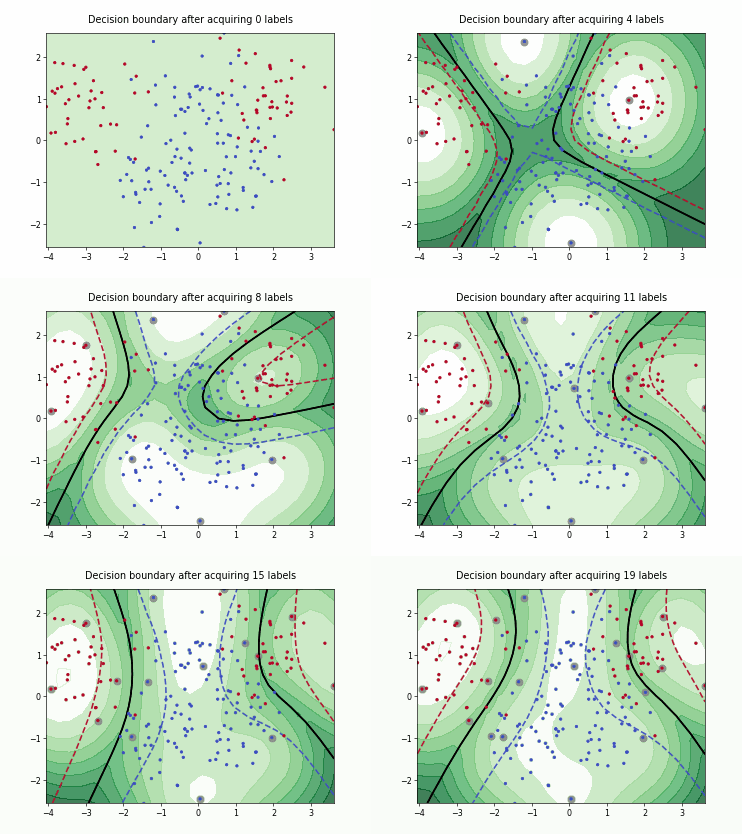
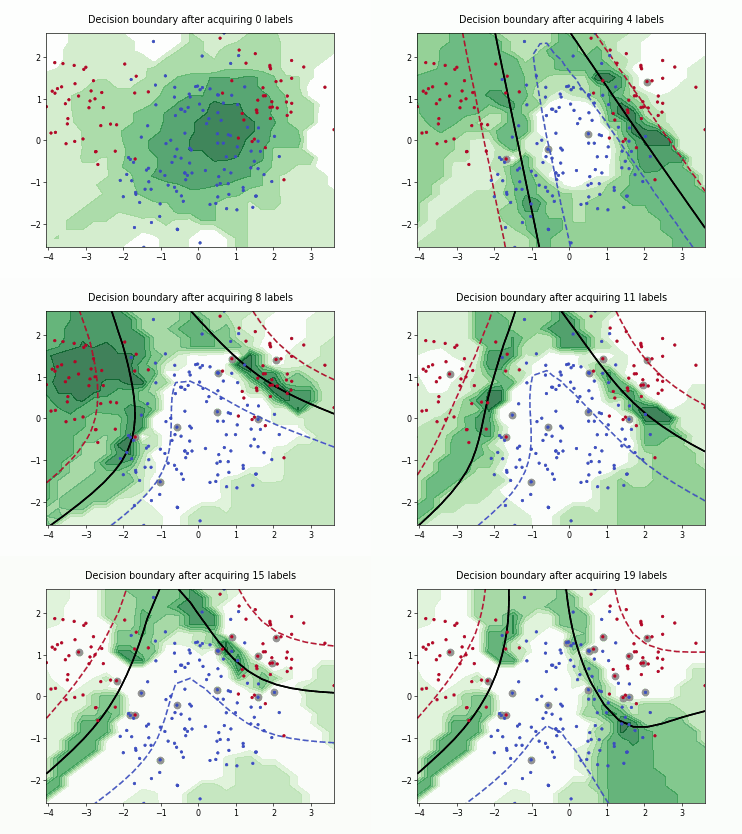
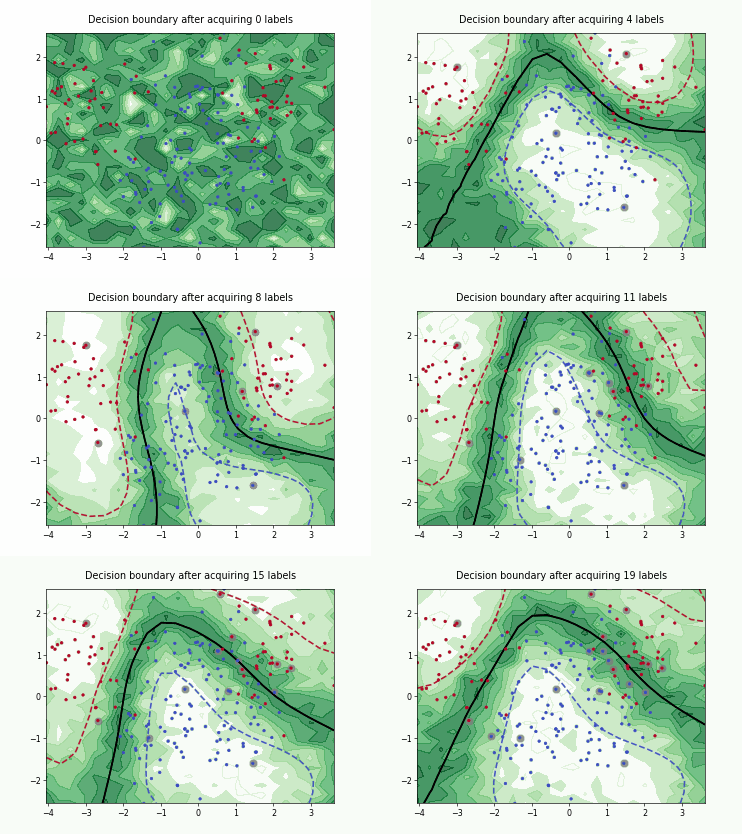
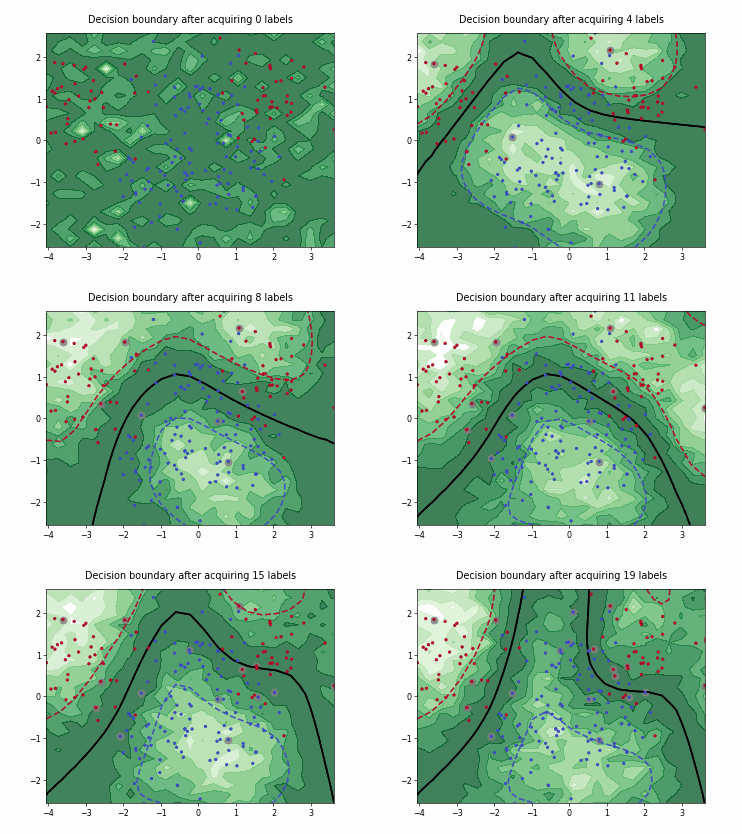
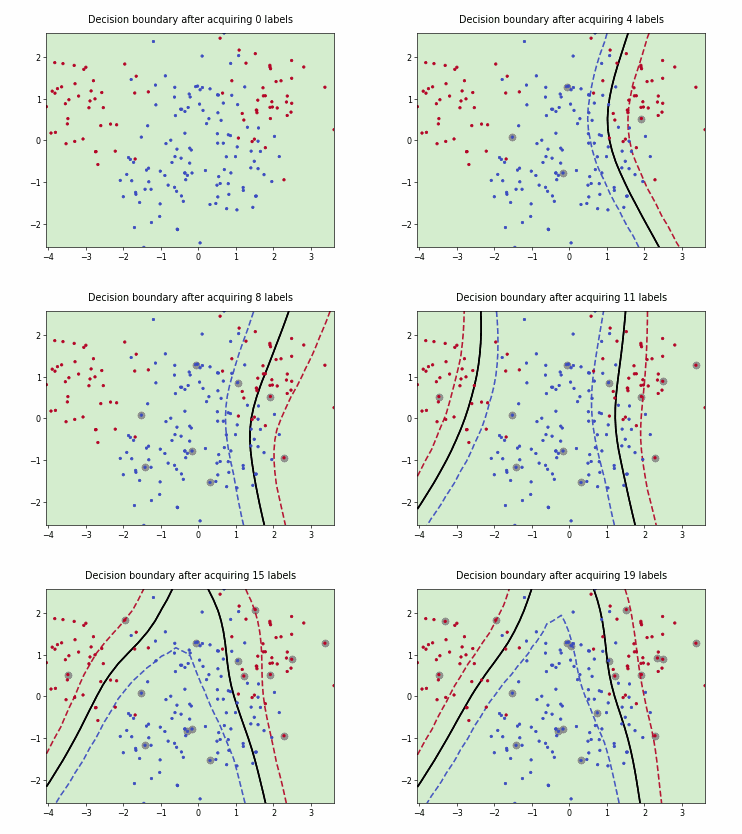
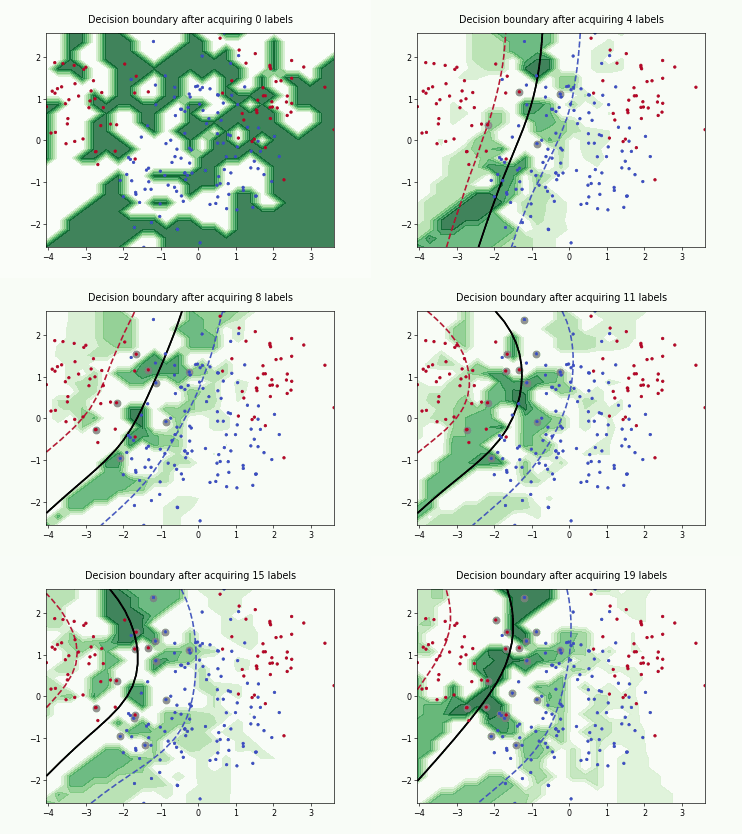
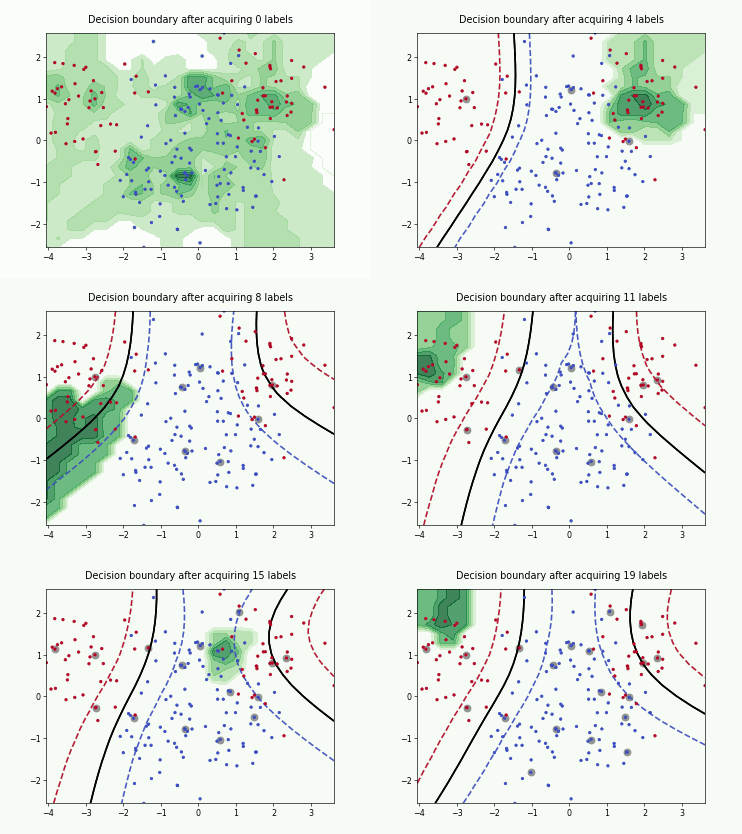
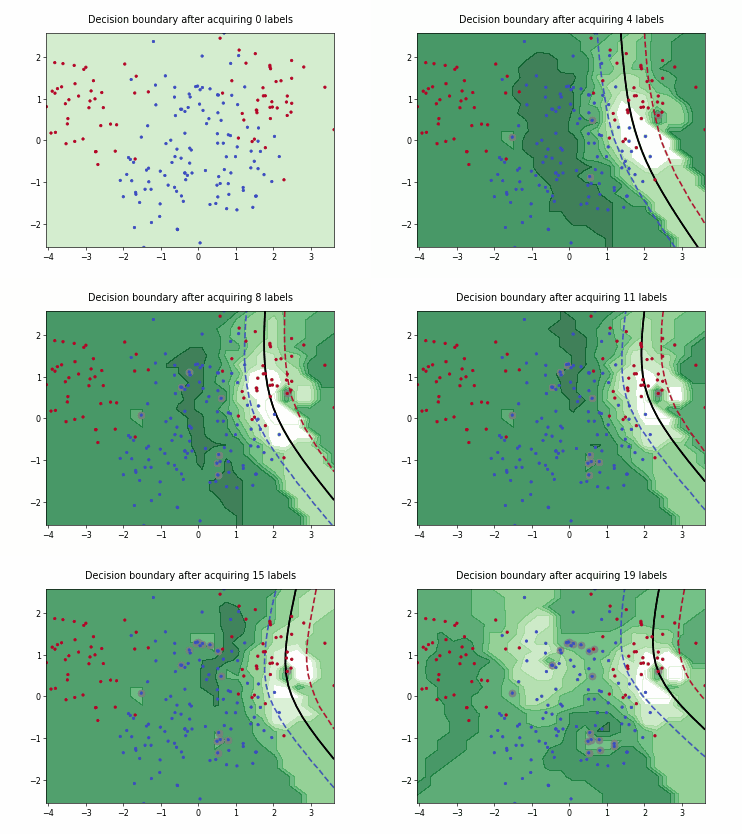
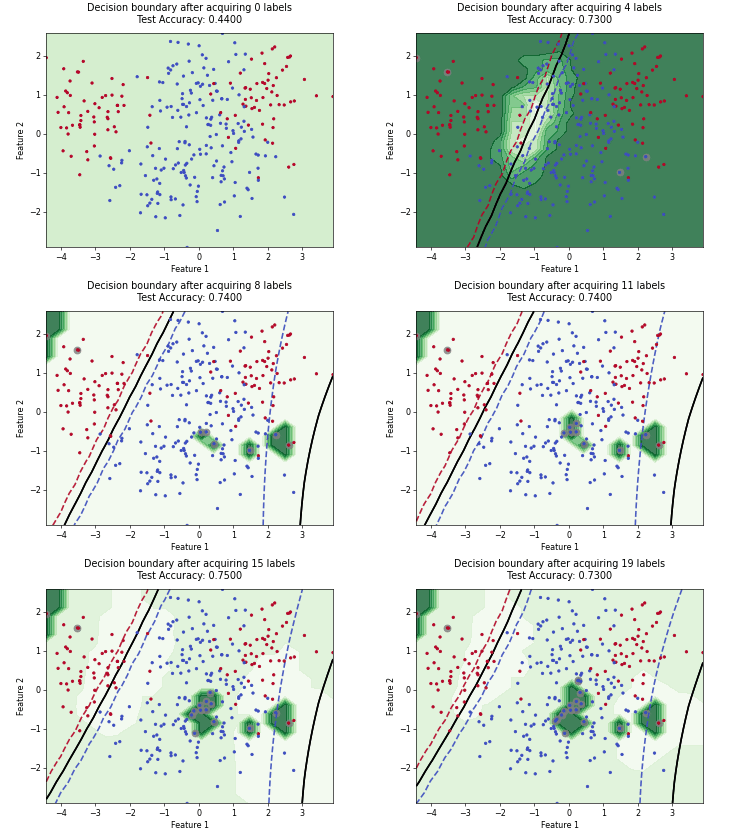
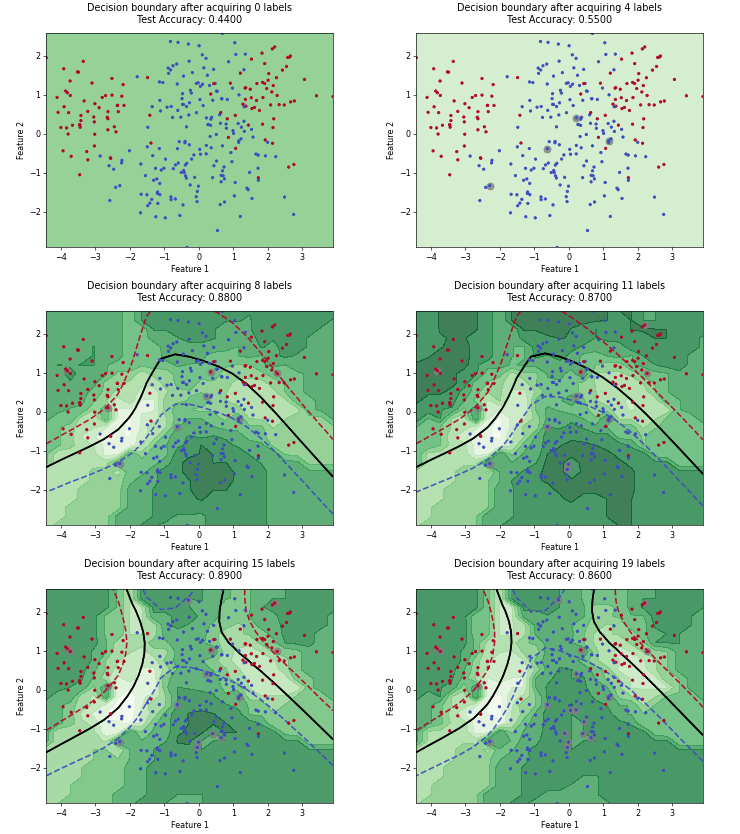
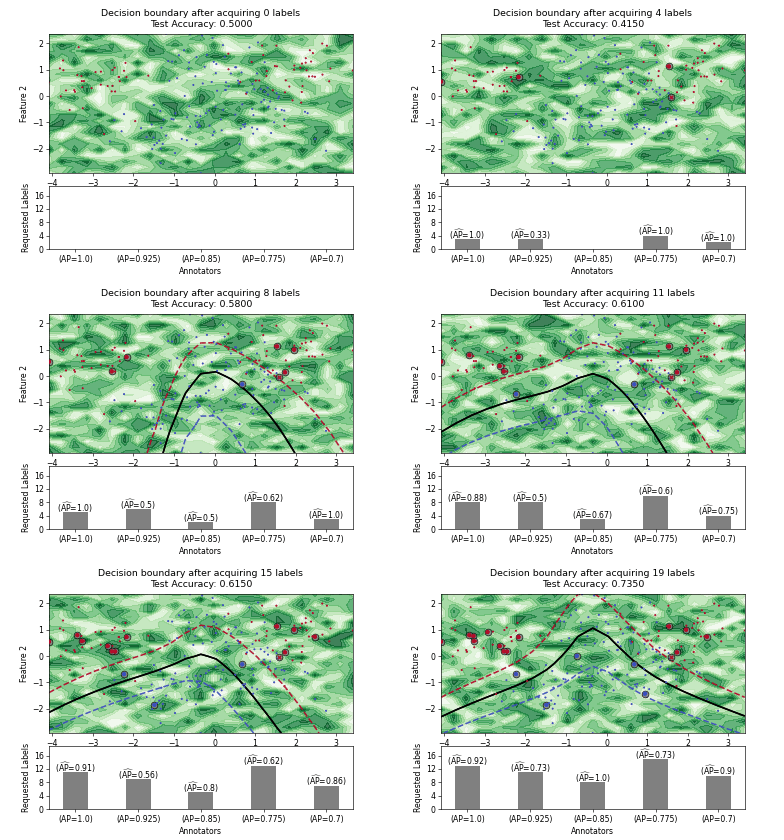
Plot the decision boundary of the given classifier.
- Parameters:
- clfsklearn.base.ClassifierMixin
The fitted classifier whose decision boundary is plotted. If confidence is not None, the classifier must implement the predict_proba function.
- feature_boundarray-like of shape [[xmin, ymin], [xmax, ymax]]
Determines the area in which the boundary is plotted.
- axmatplotlib.axes.Axes or List, default=None
The axis on which the decision boundary is plotted. If ax is a List, each entry has to be an matplotlib.axes.Axes.
- resint, default=21
The resolution of the plot.
- boundary_dictdict, default=None
Additional parameters for the boundary contour.
- confidencescalar or None, default=0.75
The confidence interval plotted with dashed lines. It is not plotted if confidence is None. Must be in the open interval (0.5, 1). The value stands for the ratio best class / second best class.
- cmapstr or matplotlib.colors.Colormap, default=’coolwarm_r’
The colormap for the confidence levels.
- confidence_dictdict, default=None
Additional parameters for the confidence contour. Must not contain a colormap because cmap is used.
- Returns:
- axmatplotlib.axes.Axes or List
The axis on which the boundary was plotted or the list of axis if ax was a list.
Examples using skactiveml.visualization.plot_decision_boundary#
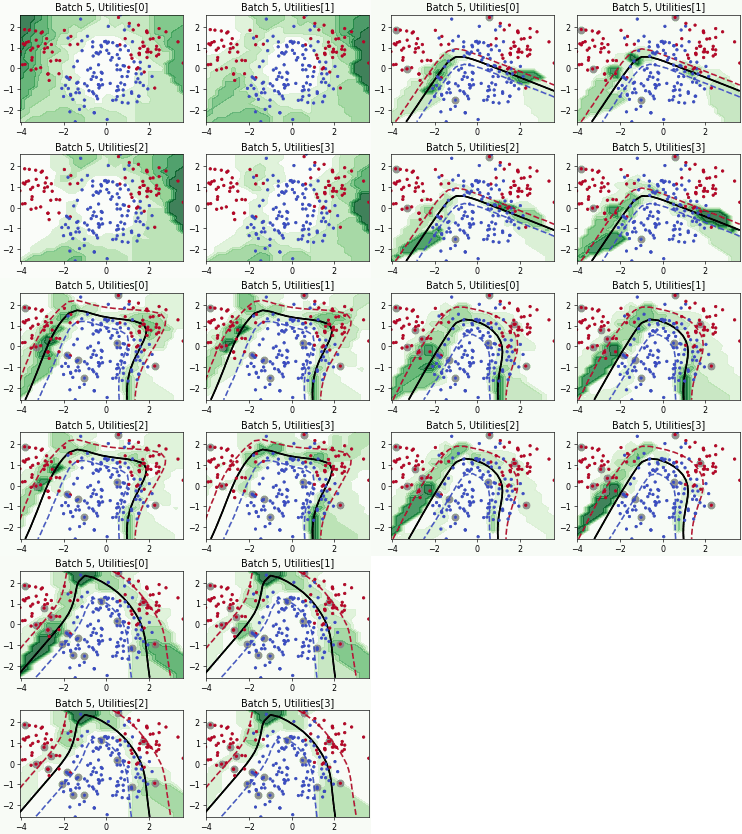
Batch Active Learning by Diverse Gradient Embedding (BADGE)
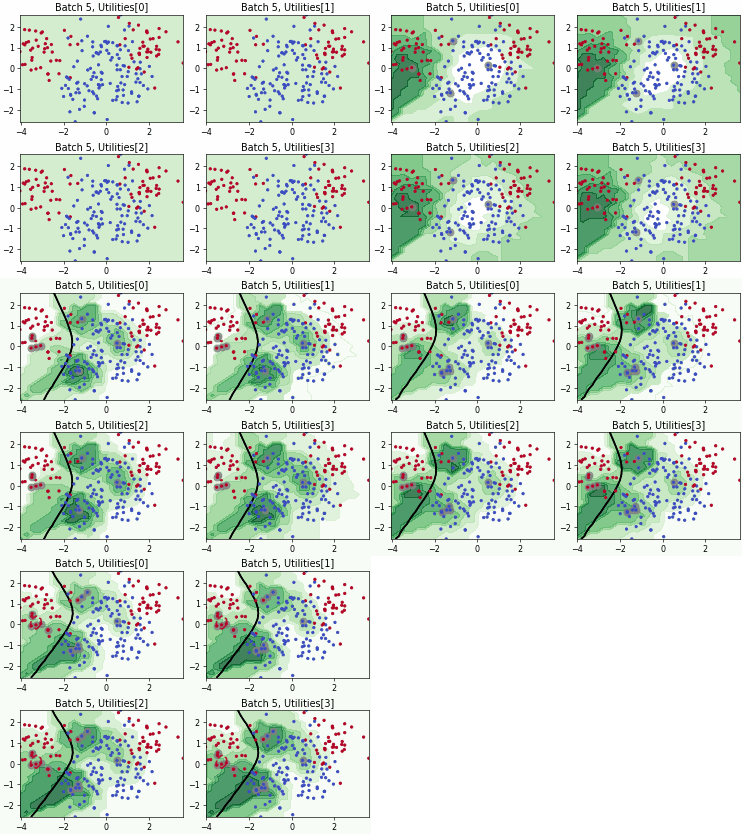
Batch Bayesian Active Learning by Disagreement (BatchBALD)
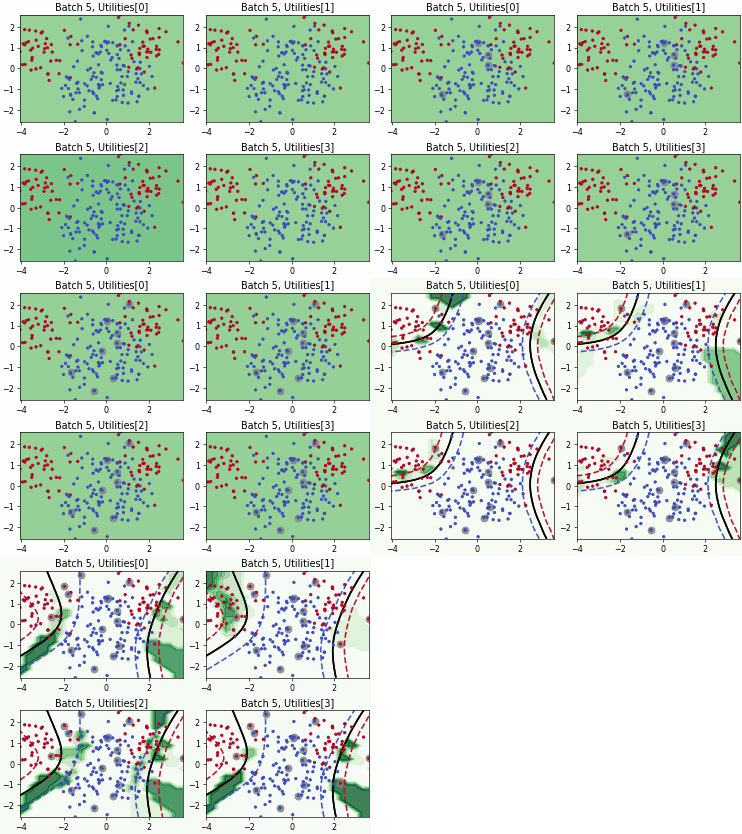
Fast Active Learning by Contrastive UNcertainty (FALCUN)
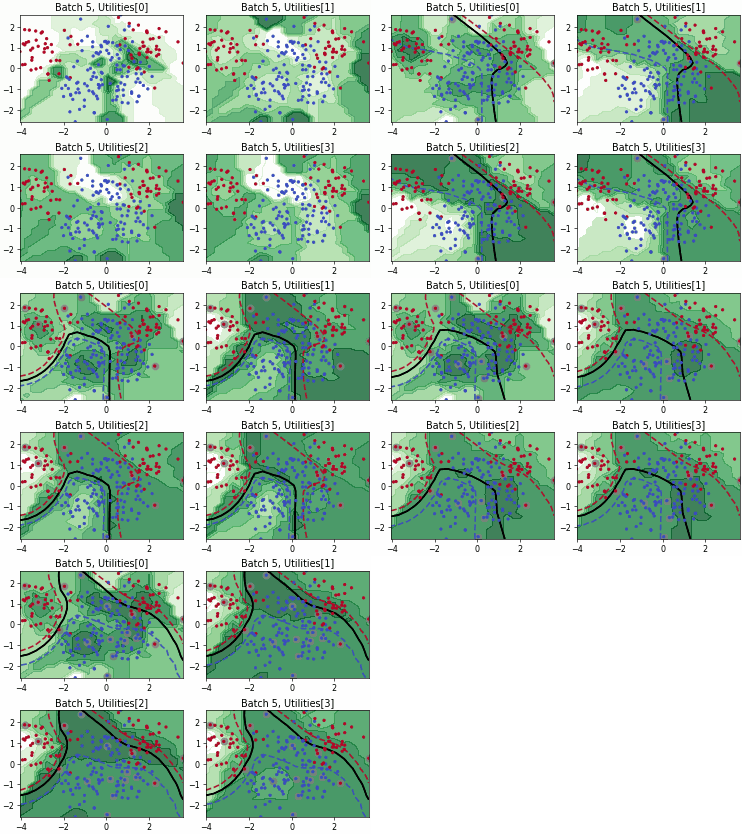
Batch Density-Diversity-Distribution-Distance Sampling (4DS)
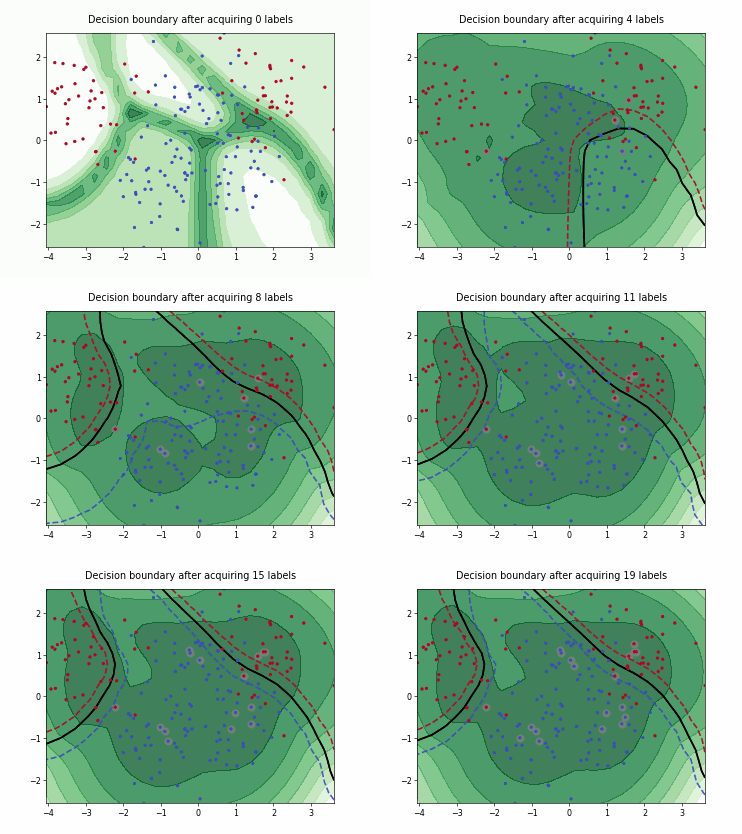
Density-Diversity-Distribution-Distance Sampling (4DS)
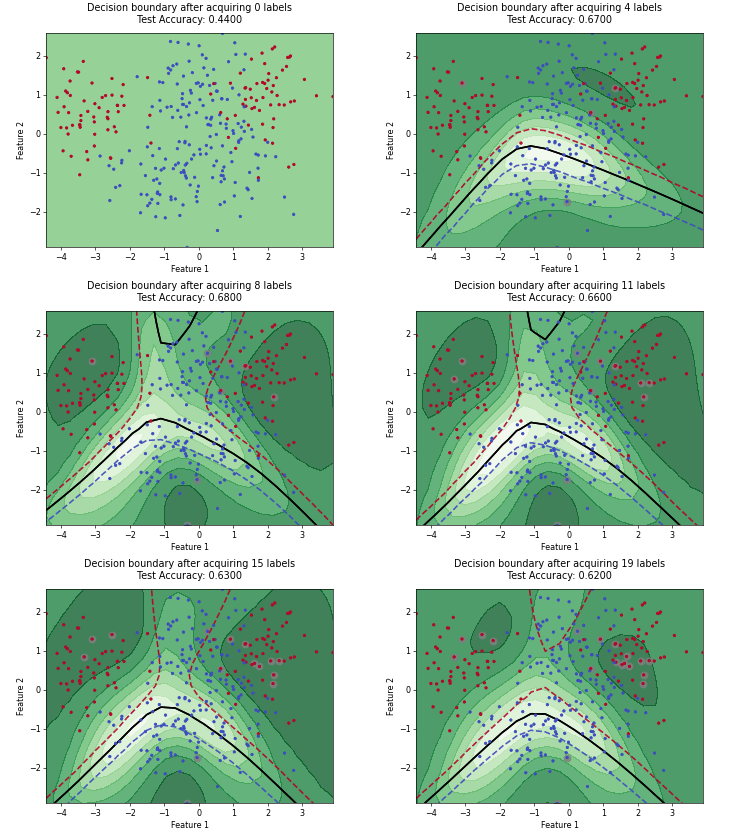
Monte-Carlo Expected Error Reduction (EER) with Log-Loss
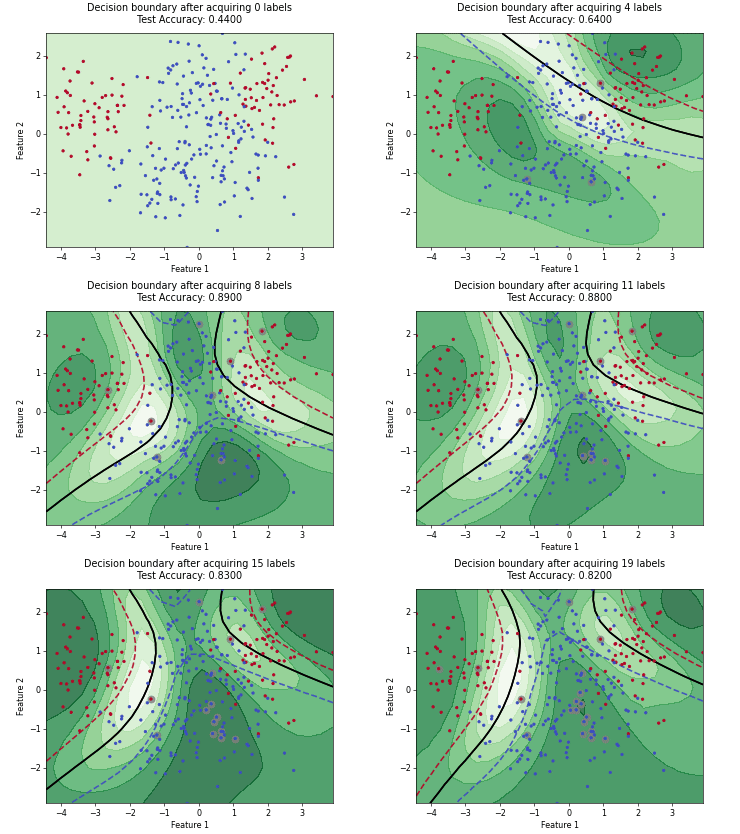
Monte-Carlo Expected Error Reduction (EER) with Misclassification-Loss
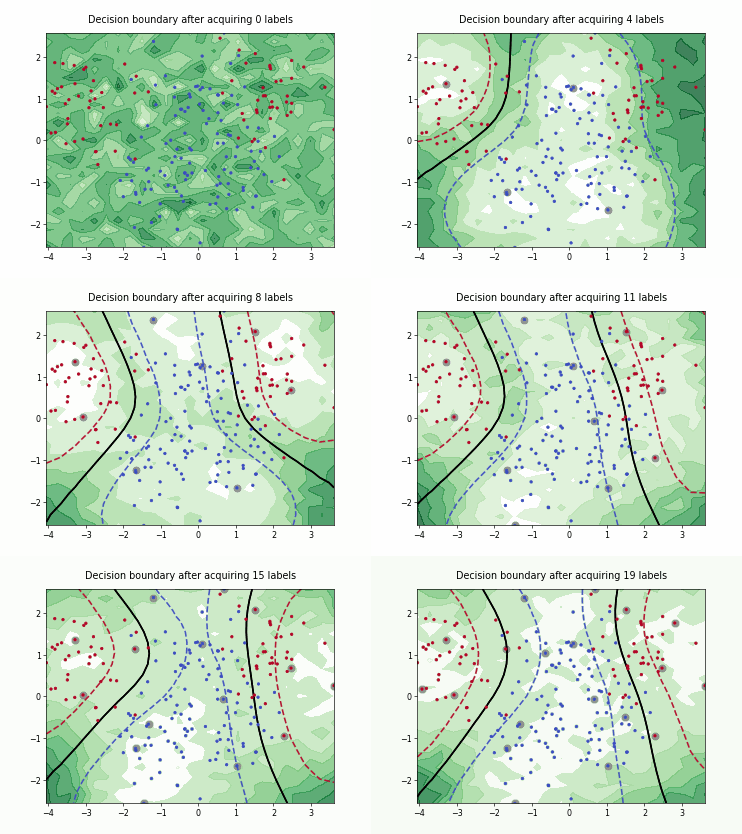
Query-by-Committee (QBC) with Kullback-Leibler Divergence
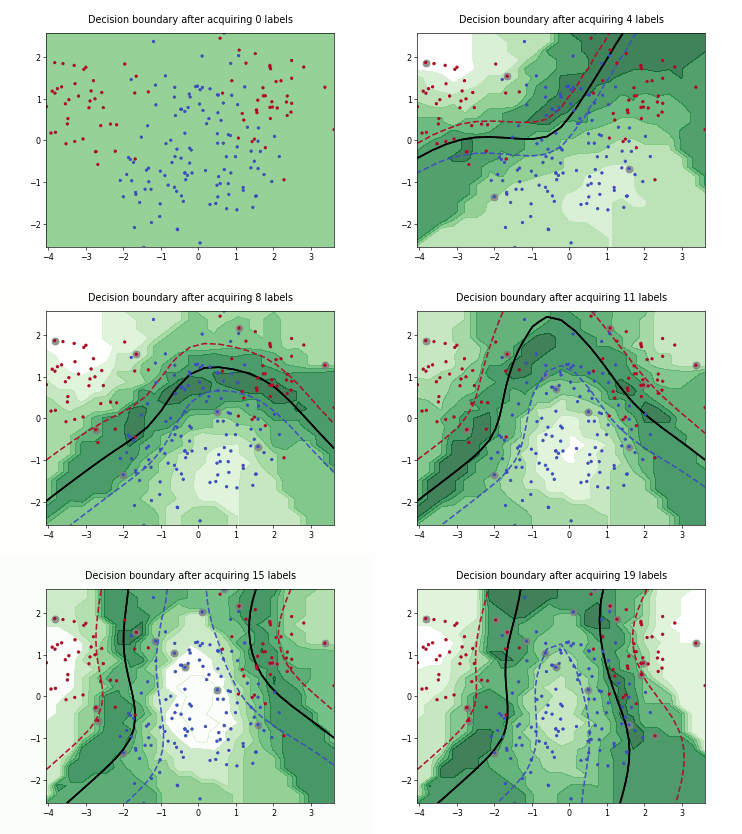
Querying Informative and Representative Examples (QUIRE)

Uncertainty Sampling with Expected Average Precision (USAP)
