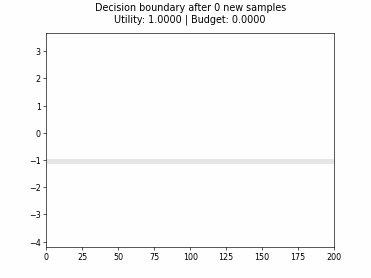
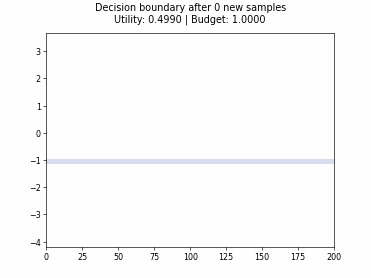
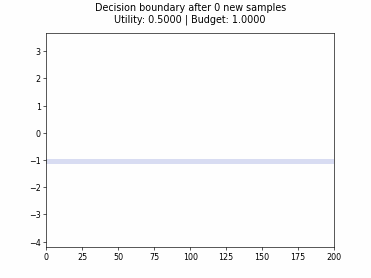
plot_stream_decision_boundary#
- skactiveml.visualization.plot_stream_decision_boundary(ax, t_x, plot_step, clf, X, pred_list, color='k', res=25)[source]#
Plot the decision boundary of the given classifier.
- Parameters:
- axmatplotlib.axes.Axes or List
The axis on which the decision boundary is plotted. If ax is a List, each entry has to be an matplotlib.axes.Axes.
- t_xint
The position of the newest instance for the x axies.
- plot_stepint
The interval in which the clf should predict new samples.
- clfsklearn.base.ClassifierMixin
The fitted classifier whose decision boundary is plotted.
- Xarray-like of shape (n_samples, 1)
Training data set, usually complete, i.e. including the labeled and unlabeled samples.
- pred_listarray-like of shape (n_samples,)
The list containing classifier prediction for the last steps.
- colorstr or matplotlib.colors.Colormap, default=’k’
The color for the decision boundary.
- resint, default=25
The resolution of the plot.
- Returns:
- axmatplotlib.axes.Axes or List
The axis on which the boundary was plotted or the list of axis if ax was a list.
- pred_listarray-like of shape (n_samples,)
The list containing classifier prediction for the last steps.
Examples using skactiveml.visualization.plot_stream_decision_boundary#

Cognitive Dual-Query Strategy with Fixed-Uncertainty

Cognitive Dual-Query Strategy with Random Sampling

Cognitive Dual-Query Strategy with Randomized-Variable-Uncertainty

Cognitive Dual-Query Strategy with Variable-Uncertainty