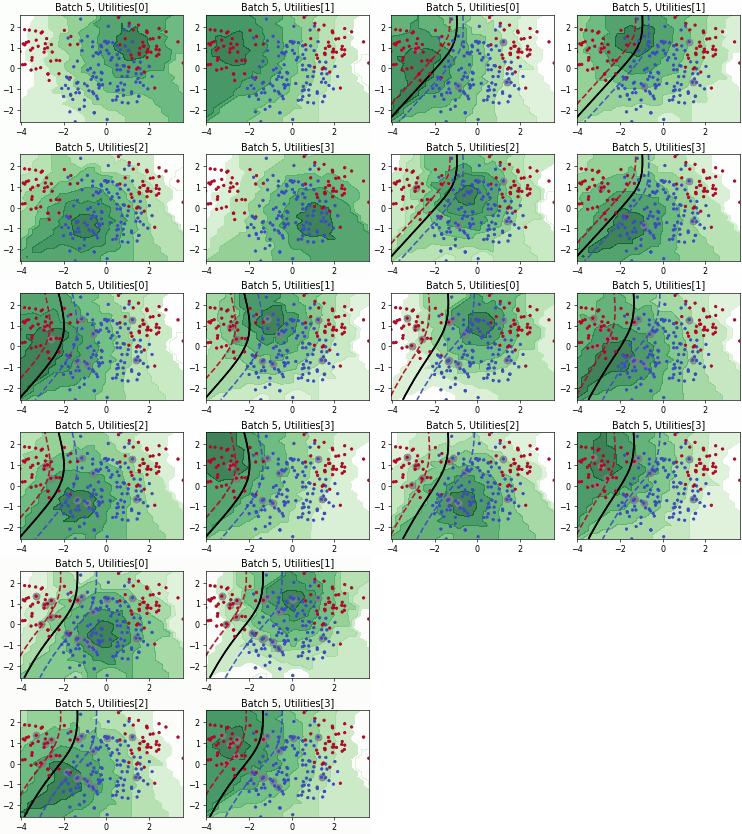
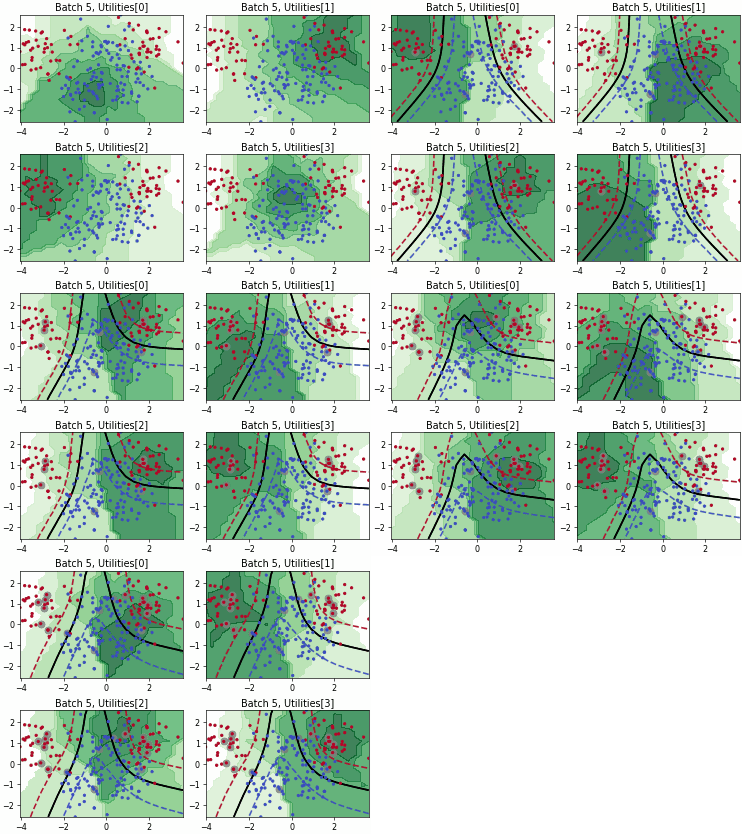
plot_contour_for_samples#
- skactiveml.visualization.plot_contour_for_samples(X, values, replace_nan=0.0, feature_bound=None, ax=None, res=21, contour_dict=None)[source]#
Plot the utility for the given query strategy.
- Parameters:
- Xarray-like of shape (n_samples, n_features)
Training data set, usually complete, i.e., including the labeled and unlabeled samples.
- valuesarray-like of shape (n_samples,)
Values to plot for samples X (may contain np.nan, can be replaced or ignored, see replace_nan).
- replace_nannumeric or None, default=0.0
If numeric, nan-values in values will be replaced by this number. If None, these samples will be ignored.
- feature_boundarray-like of shape [[xmin, ymin], [xmax, ymax]]
Determines the area in which the boundary is plotted. If candidates is not given, bound must not be None. Otherwise, the bound is determined based on the data.
- axmatplotlib.axes.Axes, default=None
The axis on which the utility is plotted. If no axis is given, the current axis (plt.gca()) will be used instead.
- resint, default=21
The resolution of the plot.
- contour_dictdict, default=None
Additional parameters for the utility contour.
- Returns:
- axmatplotlib.axes.Axes
The axis on which the utility was plotted.
Examples using skactiveml.visualization.plot_contour_for_samples#
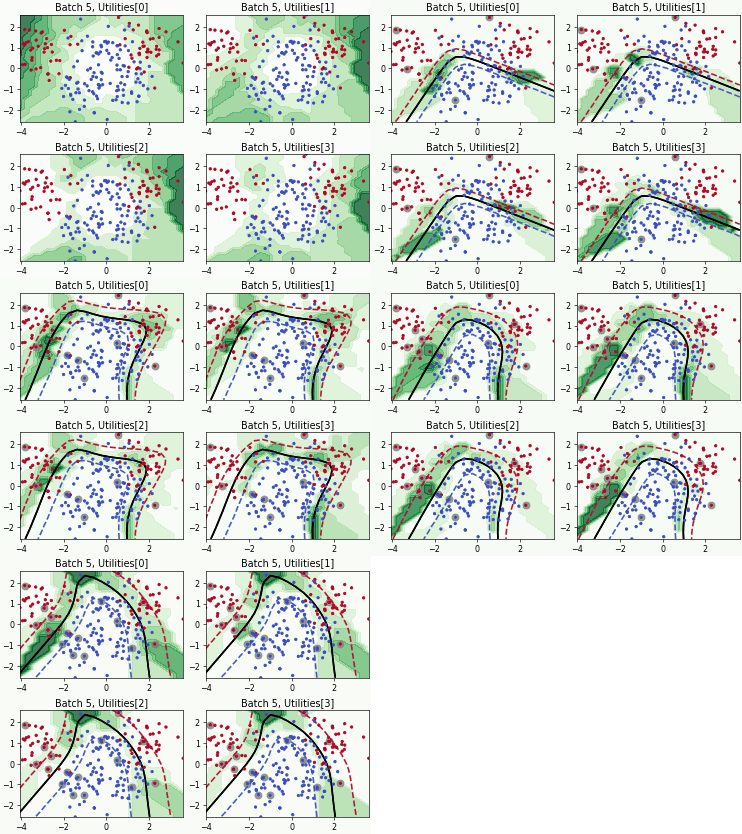
Batch Active Learning by Diverse Gradient Embedding (BADGE)
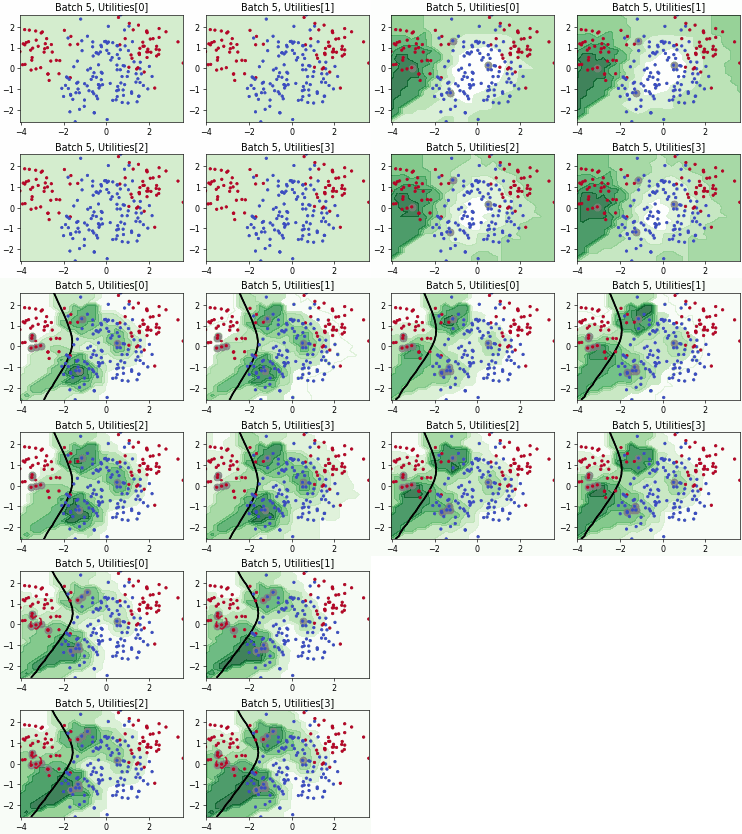
Batch Bayesian Active Learning by Disagreement (BatchBALD)
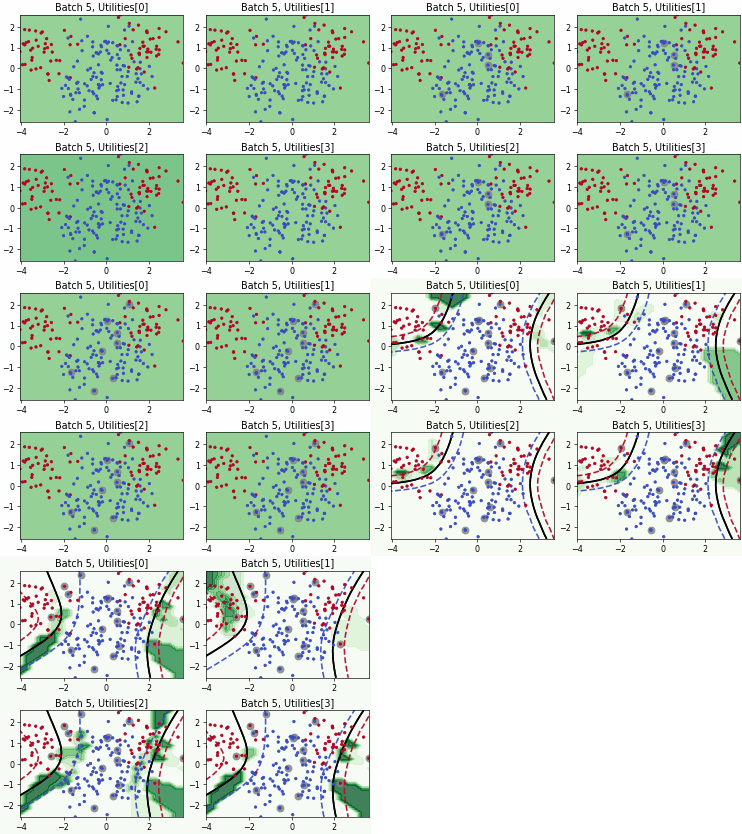
Fast Active Learning by Contrastive UNcertainty (FALCUN)
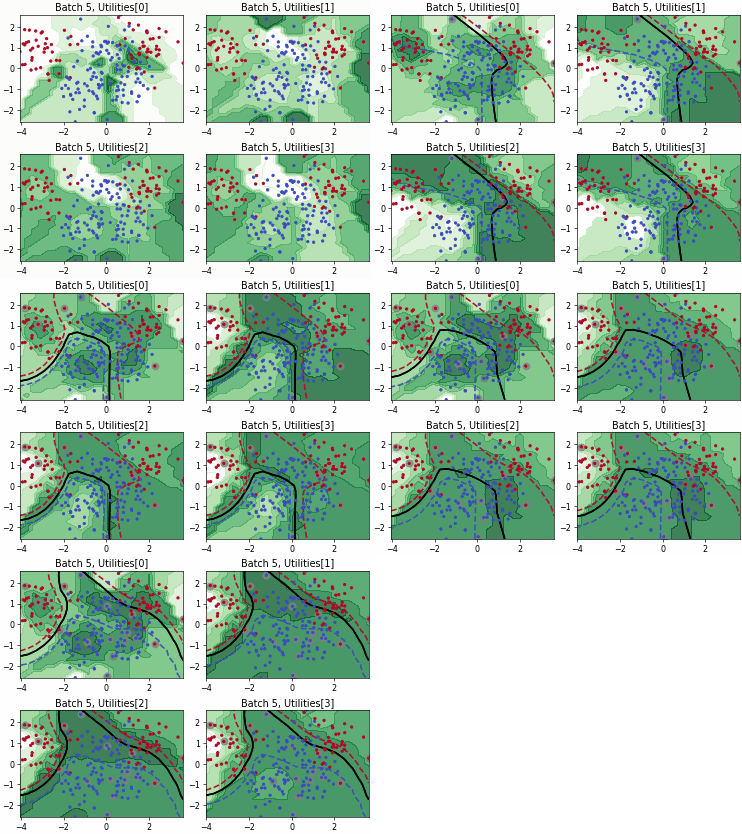
Batch Density-Diversity-Distribution-Distance Sampling (4DS)
